Category Archives: Analytics

The Finance Playbook for Scaling Complexity Without Chaos
From Controlled Growth to Operational Grace
Somewhere between Series A optimism and Series D pressure sits the very real challenge of scale. Not just growth for its own sake but growth with control, precision, and purpose. A well-run finance function becomes less about keeping the lights on and more about lighting the runway. I have seen it repeatedly. You can double ARR, but if your deal desk, revenue operations, or quote-to-cash processes are even slightly out of step, you are scaling chaos, not a company.
Finance does not scale with spreadsheets and heroics. It scales with clarity. With every dollar, every headcount, and every workflow needing to be justified in terms of scale, simplicity must be the goal. I recall sitting in a boardroom where the CEO proudly announced a doubling of the top line. But it came at the cost of three overlapping CPQ systems, elongated sales cycles, rogue discounting, and a pipeline no one trusted. We did not have a scale problem. We had a complexity problem disguised as growth.
OKRs Are Not Just for Product Teams
When finance is integrated into company OKRs, magic happens. We begin aligning incentives across sales, legal, product, and customer success teams. Suddenly, the sales operations team is not just counting bookings but shaping them. Deal desk isn’t just a speed bump before legal review, but a value architect. Our quote-to-cash process is no longer a ticketing system but a flywheel for margin expansion.
At a Series B company, their shift began by tying financial metrics directly to the revenue team’s OKRs. Quota retirement was not enough. They measured the booked gross margin. Customer acquisition cost. Implementation of velocity. The sales team was initially skeptical but soon began asking more insightful questions. Deals that initially appeared promising were flagged early. Others that seemed too complicated were simplified before they even reached RevOps. Revenue is often seen as art. But finance gives it rhythm.

Scaling Complexity Despite the Chaos
The truth is that chaos is not the enemy of scale. Chaos is the cost of momentum. Every startup that is truly growing at a pace inevitably creates complexity. Systems become tangled. Roles blur. Approvals drift. That is not failure. That is physics. What separates successful companies is not the absence of chaos but their ability to organize it.
I often compare this to managing a growing city. You do not stop new buildings from going up just because traffic worsens. You introduce traffic lights, zoning laws, and transit systems that support the growth. In finance, that means being ready to evolve processes as soon as growth introduces friction. It means designing modular systems where complexity is absorbed rather than resisted. You do not simplify the growth. You streamline the experience of growing. Read Scale by Geoffrey West. Much of my interest in complexity theory and architecture for scale comes from it. Also, look out for my book, which will be published in February 2026: Complexity and Scale: Managing Order from Chaos. This book aligns literature in complexity theory with the microeconomics of scaling vectors and enterprise architecture.
At a late-stage Series C company, the sales motion had shifted from land-and-expand to enterprise deals with multi-year terms and custom payment structures. The CPQ tool was unable to keep up. Rather than immediately overhauling the tool, they developed middleware logic that routed high-complexity deals through a streamlined approval process, while allowing low-risk deals to proceed unimpeded. The system scaled without slowing. Complexity still existed, but it no longer dictated pace.
Cash Discipline: The Ultimate Growth KPI
Cash is not just oxygen. It is alignment. When finance speaks early and often about burn efficiency, marginal unit economics, and working capital velocity, we move from gatekeepers to enablers. I often remind founders that the cost of sales is not just the commission plan. It’s in the way deals are structured. It’s in how fast a contract can be approved. It’s in how many hands a quote needs to pass through.
At one Series A professional services firm, they introduced a “Deal ROI Calculator” at the deal desk. It calculated not just price and term but implementation effort, support burden, and payback period. The result was staggering. Win rates remained stable, but average deal profitability increased by 17 percent. Sales teams began choosing deals differently. Finance was not saying no. It was saying, “Say yes, but smarter.”
Velocity is a Decision, Not a Circumstance
The best-run companies are not faster because they have fewer meetings. They are faster because decisions are closer to the data. Finance’s job is to put insight into the hands of those making the call. The goal is not to make perfect decisions. It is to make the best decision possible with the available data and revisit it quickly.
In one post-Series A firm, we embedded finance analysts inside revenue operations. It blurred the traditional lines but sped up decision-making. Discount approvals have been reduced from 48 hours to 12-24 hours. Pricing strategies became iterative. A finance analyst co-piloted the forecast and flagged gaps weeks earlier than our CRM did. It wasn’t about more control. It was about more confidence.
When Process Feels Like Progress
It is tempting to think that structure slows things down. However, the right QTC design can unlock margin, trust, and speed simultaneously. Imagine a deal desk that empowers sales to configure deals within prudent guardrails. Or a contract management workflow that automatically flags legal risks. These are not dreams. These are the functions we have implemented.
The companies that scale well are not perfect. But their finance teams understand that complexity compounds quietly. And so, we design our systems not to prevent chaos but to make good decisions routine. We don’t wait for the fire drill. We design out the fire.
Make Your Revenue Operations Your Secret Weapon
If your finance team still views sales operations as a reporting function, you are underutilizing a strategic lever. Revenue operations, when empowered, can close the gap between bookings and billings. They can forecast with precision. They can flag incentive misalignment. One of the best RevOps leaders I worked with used to say, “I don’t run reports. I run clarity.” That clarity was worth more than any point solution we bought.
In scaling environments, automation is not optional. But automation alone does not save a broken process. Finance must own the blueprint. Every system, from CRM to CPQ to ERP, must speak the same language. Data fragmentation is not just annoying. It is value-destructive.
What Should You Do Now?
Ask yourself: Does finance have visibility into every step of the revenue funnel? Do our QTC processes support strategic flexibility? Is our deal desk a source of friction or a source of enablement? Can our sales comp plan be audited and justified in a board meeting without flinching?
These are not theoretical. They are the difference between Series C confusion and Series D confidence.
Let’s Make This Personal
I have seen incredible operators get buried under process debt because they mistook motion for progress. I have seen lean finance teams punch above their weight because they anchored their operating model in OKRs, cash efficiency, and rapid decision cycles. I have also seen the opposite. A sales ops function sitting in the corner. A deal desk no one trusts. A QTC process where no one knows who owns what.
These are fixable. But only if finance decides to lead. Not just report.
So here is my invitation. If you are a CFO, a CRO, a GC, or a CEO reading this, take one day this quarter to walk your revenue path from lead to cash. Sit with the people who feel the friction. Map the handoffs. And then ask, is this how we scale with control? Do you have the right processes in place? Do you have the technology to activate the process and minimize the friction?

Beyond the Buzz: The Real Economics Behind SaaS, AI, and Everything in Between
Introduction
Throughout my career, I have had the privilege of working in and leading finance teams across several SaaS companies. The SaaS model is familiar territory to me: its economics are well understood, its metrics are measurable, and its value creation pathways have been tested over time. Erich Mersch’s book on SaaS Hacks is my Bible. In contrast, my exposure to pure AI companies has been more limited. I have directly supported two AI-driven businesses, and much of my perspective comes from observation, benchmarking, and research. This combination of direct experience and external study has hopefully shaped a balanced view: one grounded in practicality yet open to the new dynamics emerging in the AI era.
Across both models, one principle remains constant: a business is only as strong as its unit economics. When leaders understand the economics of their business, they gain the ability to map them to daily operations, and from there, to the financial model. The linkage from unit economics to operations to financial statements is what turns financial insight into strategic control. It ensures that decisions on pricing, product design, and investment are all anchored in how value is truly created and captured.
Today, CFOs and CEOs must not only manage their profit and loss (P&L) statement but also understand the anatomy of revenue, cost, and cash flow at the micro level. SaaS, AI, and hybrid SaaS-AI models each have unique economic signatures. SaaS rewards scalability and predictability. AI introduces variability and infrastructure intensity. Hybrids offer both opportunity and complexity. This article examines the financial structure, gross margin profile, and investor lens of each model to help finance leaders not only measure performance but also interpret it by turning data into judgment and judgment into a better strategy.
Part I: SaaS Companies — Economics, Margins, and Investor Lens
The heart of any SaaS business is its recurring revenue model. Unlike traditional software, where revenue is recognized upfront, SaaS companies earn revenue over time as customers subscribe to a service. This shift from ownership to access creates predictable revenue streams but also introduces delayed payback cycles and continuous obligations to deliver value. Understanding the unit economics behind this model is essential for CFOs and CEOs, as it enables them to see beyond top-line growth and assess whether each customer, contract, or cohort truly creates long-term value.
A strong SaaS company operates like a flywheel. Customer acquisition drives recurring revenue, which funds continued innovation and improved service, in turn driving more customer retention and referrals. But a flywheel is only as strong as its components. The economics of SaaS can be boiled down to a handful of measurable levers: gross margin, customer acquisition cost, retention rate, lifetime value, and cash efficiency. Each one tells a story about how the company converts growth into profit.
The SaaS Revenue Engine
At its simplest, a SaaS company makes money by providing access to its platform on a subscription basis. The standard measure of health is Annual Recurring Revenue (ARR). ARR represents the contracted annualized value of active subscriptions. It is the lifeblood metric of the business. When ARR grows steadily with low churn, the company can project future cash flows with confidence.
Revenue recognition in SaaS is governed by time. Even if a customer pays upfront, the revenue is recognized over the duration of the contract. This creates timing differences between bookings, billings, and revenue. CFOs must track all three to understand both liquidity and profitability. Bookings signal demand, billings signal cash inflow, and revenue reflects the value earned.
One of the most significant advantages of SaaS is predictability. High renewal rates lead to stable revenues. Upsells and cross-sells increase customer lifetime value. However, predictability can also mask underlying inefficiencies. A SaaS business can grow fast and still destroy value if each new customer costs more to acquire than they bring in lifetime revenue. This is where unit economics comes into play.
Core Unit Metrics in SaaS
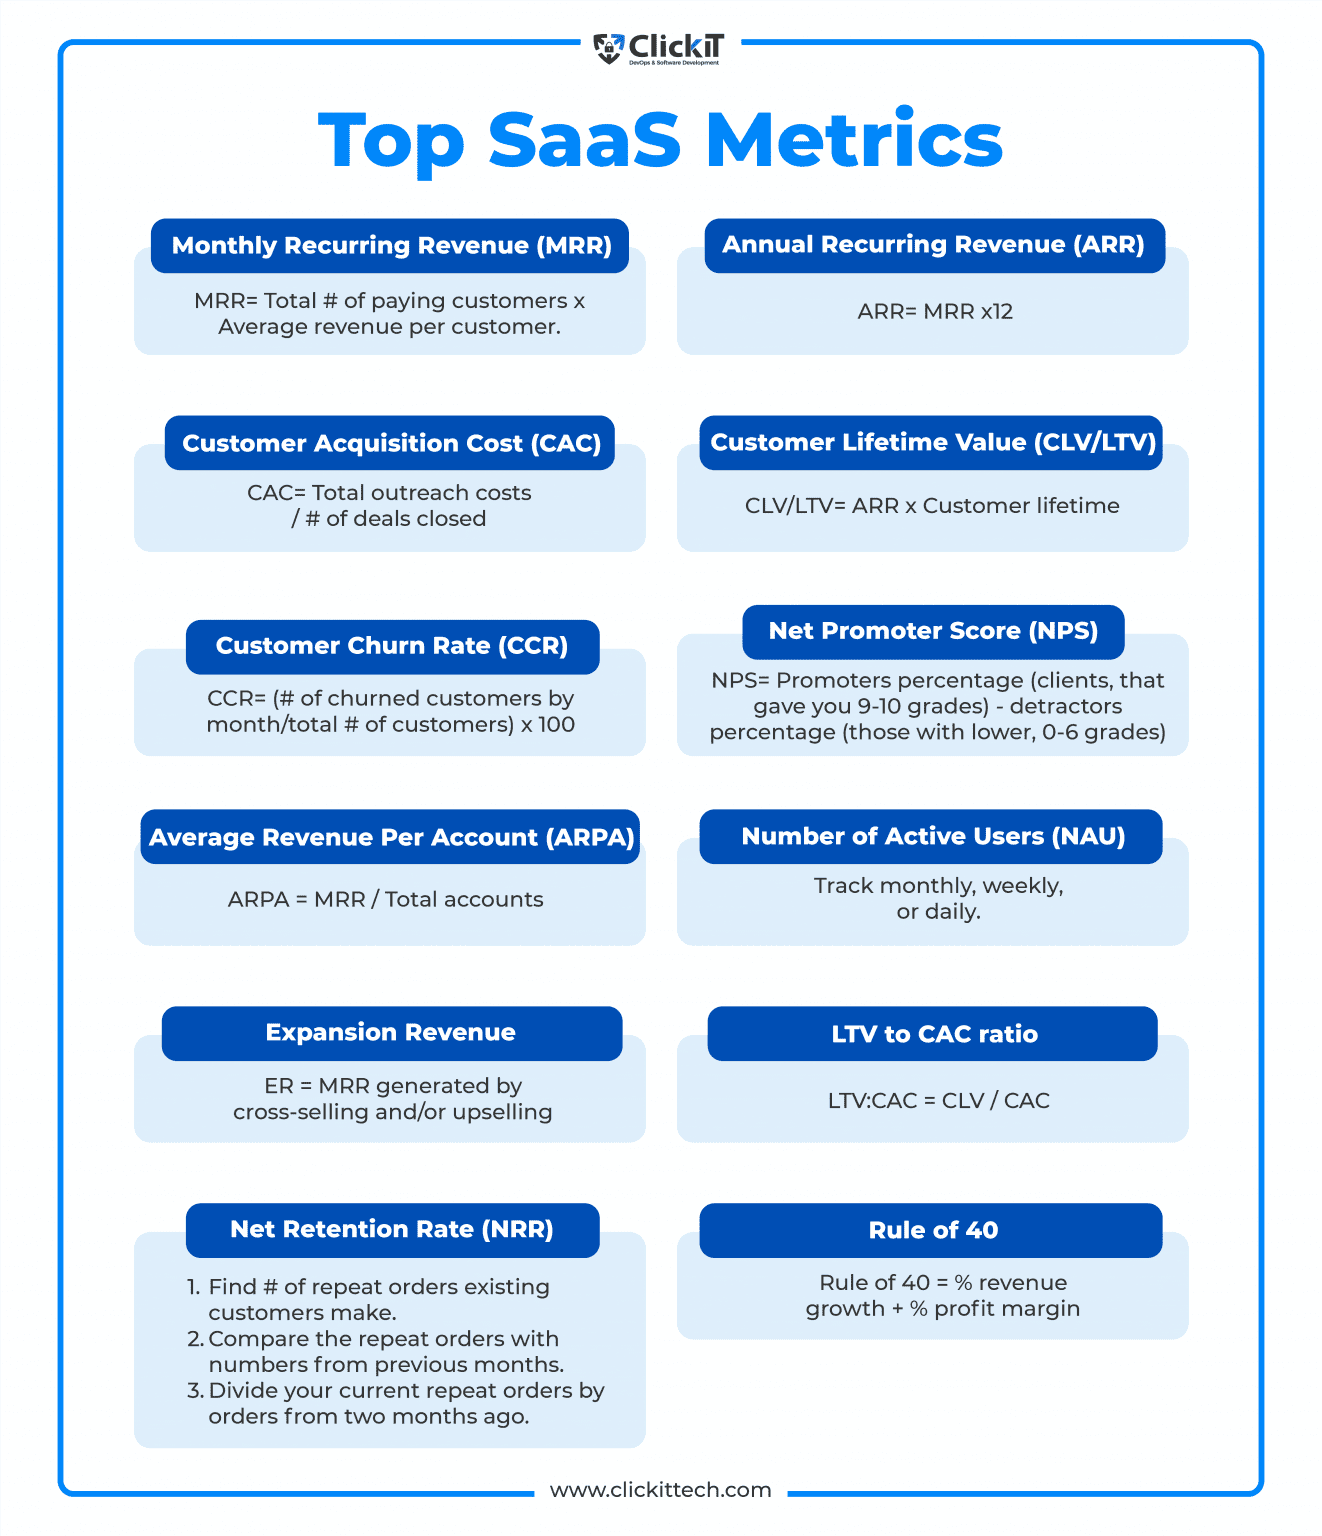
The three central metrics every CFO and CEO must know are:
- Customer Acquisition Cost (CAC): The total sales and marketing expenses needed to acquire one new customer.
- Lifetime Value (LTV): The total revenue a customer is expected to generate over their relationship with the company.
- Payback Period: The time it takes for gross profit from a customer to recover CAC.
A healthy SaaS business typically maintains an LTV-to-CAC ratio of at least 3:1. This means that for every dollar spent acquiring a customer, the company earns three dollars in lifetime value. Payback periods under twelve months are typically considered strong, especially in mid-market or enterprise SaaS. Long payback periods signal cash inefficiency and high-risk during downturns.
Retention is equally essential. The stickier the product, the lower the churn, and the more predictable the revenue. Net revenue retention (NRR) is a powerful metric because it combines churn and expansion. A business with 120 percent NRR is growing revenue even without adding new customers, which investors love to see.
Gross Margin Dynamics
Gross margin is the backbone of SaaS profitability. It measures how much of each revenue dollar remains after deducting direct costs, such as hosting, support, and third-party software fees. Well-run SaaS companies typically achieve gross margins of between 75% and 85%. This reflects the fact that software is highly scalable. Once built, it can be replicated at almost no additional cost. They use the margins to fund their GTM strategy. They have room until they don’t.
However, gross margin is not guaranteed. In practice, it can erode for several reasons. First, rising cloud infrastructure costs can quietly eat into margins if not carefully managed. Companies that rely heavily on AWS, Azure, or Google Cloud need cost optimization strategies, including reserved instances and workload tuning. Second, customer support and success functions, while essential, can become heavy if processes are not automated. Third, complex integrations or data-heavy products can increase variable costs per customer.
Freemium and low-entry pricing models can also dilute margins if too many users remain on free tiers or lower-paying plans. The CFO’s job is to ensure that pricing reflects the actual value delivered and that the cost-to-serve remains aligned with revenue per user. A mature SaaS company tracks unit margins by customer segment to identify where profitability thrives or erodes.
Operating Leverage and the Rule of 40
The power of SaaS lies in its potential for operating leverage. Fixed costs, such as R&D, engineering, and sales infrastructure, remain relatively constant as revenue scales. As a result, incremental revenue flows disproportionately to the bottom line once the business passes break-even. This makes SaaS an attractive model once scale is achieved, although reaching that scale can take a considerable amount of time.
The Rule of 40 is a shorthand metric many investors use to gauge the balance between growth and profitability. It states that a SaaS company’s revenue growth rate, plus its EBITDA margin, should equal or exceed 40 percent. A company growing 30 percent annually with a 15 percent EBITDA margin scores 45, which is considered healthy. A company growing at 60 percent but losing 30 percent EBITDA would score 30, suggesting inefficiency. This rule forces management to strike a balance between ambition and discipline. This 40% rule was based on empirical analysis, and every Jack and Jill swears by it. I am not sure that we can have this Rule and apply it blindly. I am not generally in favor of these broad rules. That is a lot of fodder for a different conversation.
Cash Flow and Efficiency
Cash flow timing is another defining feature of SaaS. Many customers prepay annually, creating favorable working capital dynamics. This gives SaaS companies negative net working capital, which can help fund growth. However, high upfront CAC and long payback periods can strain cash reserves. CFOs must ensure growth is financed efficiently and that burn multiples remain sustainable. Burn-multiple measures the cash burn relative to net new ARR added. A burn rate of multiple below 1 is excellent; it means the company spends one dollar to generate one dollar of recurring revenue. Ratios above 2 suggest inefficiency.
As markets have tightened, investors have shifted focus from pure growth to efficient growth. Cash is no longer cheap, and dilution from equity raises is costly. I attended a networking event in San Jose about a month ago, and one of the finance leaders said, “We are in the middle of a nuclear winter.” I thought that summarized the current state of the funding market. Therefore, SaaS CFOs must guide companies toward self-funding growth, improving gross margins, and shortening CAC payback cycles.
Valuation and Investor Perspective
Investors view SaaS companies through the lens of predictability, scalability, and margin potential. Historically, during low-interest-rate periods, high-growth SaaS companies traded at 10 to 15 times ARR. In the current normalized environment, top performers trade between 5 and 8 times ARR, with discounts for slower growth or lower margins.
The key drivers of valuation include:
- Growth Rate: Faster ARR growth leads to higher multiples, provided it is efficient.
- Gross Margin: High margins indicate scalability and control over cost structure.
- Retention and Expansion: Strong NRR signals durable revenue and pricing power.
- Profitability Trajectory: Investors reward companies that balance growth with clear paths to cash flow breakeven.
Investors now differentiate between the quality of growth and the quantity of growth. Revenue driven by deep discounts or heavy incentives is less valuable than revenue driven by customer adoption and satisfaction. CFOs must clearly communicate cohort performance, renewal trends, and contribution margins to demonstrate that growth is sustainable and durable.
Emerging Challenges in SaaS Economics
While SaaS remains a powerful model, new challenges have emerged. Cloud infrastructure costs are rising, putting pressure on gross margins. AI features are becoming table stakes, but they introduce new variable costs tied to compute. Customer expectations are also shifting toward usage-based pricing, which can lead to reduced predictability in revenue recognition.
To navigate these shifts, CFOs must evolve their financial reporting and pricing strategies. Gross margin analysis must now include compute efficiency metrics. Sales compensation plans must reflect profitability, not just bookings. Pricing teams must test elasticity to ensure ARPU growth outpaces cost increases.
SaaS CFOs must also deepen their understanding of cohort economics. Not all customers are equal. Some segments deliver faster payback and higher retention, while others create drag. Segmented reporting enables management to allocate capital wisely and avoid pursuing unprofitable markets.
The Path Forward
The essence of SaaS unit economics is discipline. Growth only creates value when each unit of growth strengthens the financial foundation. This requires continuous monitoring of margins, CAC, retention, and payback. It also requires cross-functional collaboration between finance, product, and operations. Finance must not only report outcomes but also shape strategy, ensuring that pricing aligns with value and product decisions reflect cost realities.
For CEOs, understanding these dynamics is vital to setting priorities. For CFOs, the task is to build a transparent model that links operational levers to financial outcomes. Investors reward companies that can tell a clear story with data: a path from top-line growth to sustainable free cash flow.
Ultimately, SaaS remains one of the most attractive business models when executed effectively. The combination of recurring revenue, high margins, and operating leverage creates long-term compounding value. But it rewards precision. The CFO who masters unit economics can turn growth into wealth, while the one who ignores it may find that scale without discipline is simply a faster road to inefficiency. The king is not dead: Long live the king.
Part II: Pure AI Companies — Economics, Margins, and Investor Lens
Artificial intelligence companies represent a fundamentally different business model from traditional SaaS. Where SaaS companies monetize access to pre-built software, AI companies monetize intelligence: the ability of models to learn, predict, and generate. This shift changes everything about unit economics. The cost per unit of value is no longer near zero. It is tied to the underlying cost of computation, data processing, and model maintenance. As a result, CFOs and CEOs leading AI-first companies must rethink what scale, margin, and profitability truly mean.
While SaaS scales easily once software is built, AI scales conditionally. Each customer interaction may trigger new inference requests, consume GPU time, and incur variable costs. Every additional unit of demand brings incremental expenses. The CFO’s challenge is to translate these technical realities into financial discipline, which involves building an organization that can sustain growth without being constrained by its own cost structure.
Understanding the AI Business Model
AI-native companies generate revenue by providing intelligence as a service. Their offerings typically fall into three categories:
- Platform APIs: Selling access to models that perform tasks such as image recognition, text generation, or speech processing.
- Enterprise Solutions: Custom model deployments tailored for specific industries like healthcare, finance, or retail.
- Consumer Applications: AI-powered tools like copilots, assistants, or creative generators.
Each model has unique economics. API-based businesses often employ usage-based pricing, resembling utilities. Enterprise AI firms resemble consulting hybrids, blending software with services. Consumer AI apps focus on scale, requiring low-cost inference to remain profitable.
Unlike SaaS subscriptions, AI revenue is often usage-driven. This makes it more elastic but less predictable. When customers consume more tokens, queries, or inferences, revenue rises but so do costs. This tight coupling between revenue and cost means margins depend heavily on technical efficiency. CFOs must treat cost-per-inference as a central KPI, just as SaaS leaders track gross margin percentage.
Gross Margins and Cost Structures
For pure AI companies, the gross margin reflects the efficiency of their infrastructure. In the early stages, margins often range between 40% and 60%. With optimization, some mature players approach 70 percent or higher. However, achieving SaaS-like margins requires significant investment in optimization techniques, such as model compression, caching, and hardware acceleration.
The key cost components include:
- Compute: GPU and cloud infrastructure costs are the most significant variable expenses. Each inference consumes compute cycles, and large models require expensive hardware.
- Data: Training and fine-tuning models involve significant data acquisition, labeling, and storage costs.
- Serving Infrastructure: Orchestration, latency management, and load balancing add further expenses.
- Personnel: Machine learning engineers, data scientists, and research teams represent high fixed costs.
Unlike SaaS, where the marginal cost per user declines toward zero, AI marginal costs can remain flat or even rise with increasing complexity. The more sophisticated the model, the more expensive it is to serve each request. CFOs must therefore design pricing strategies that match the cost-to-serve, ensuring unit economics remain positive.
To track progress, leading AI finance teams adopt new metrics such as cost per 1,000 tokens, cost per inference, or cost per output. These become the foundation for gross margin improvement programs. Without these metrics, management cannot distinguish between profitable and loss-making usage.
Capital Intensity and Model Training
A defining feature of AI economics is capital intensity. Training large models can cost tens or even hundreds of millions of dollars. These are not operating expenses in the traditional sense; they are long-term investments. The question for CFOs is how to treat them. Should they be expensed, like research and development, or capitalized, like long-lived assets? The answer depends on accounting standards and the potential for model reuse.
If a model will serve as a foundation for multiple products or customers over several years, partial capitalization may be a defensible approach. However, accounting conservatism often favors expensing, which depresses near-term profits. Regardless of treatment, management must view training costs as sunk investments that must earn a return through widespread reuse.
Due to these high upfront costs, AI firms must carefully plan their capital allocation. Not every model warrants training from scratch. Fine-tuning open-source or pre-trained models may achieve similar outcomes at a fraction of the cost. The CFO’s role is to evaluate return on invested capital in R&D and ensure technical ambition aligns with commercial opportunity.
Cash Flow Dynamics
Cash flow management in AI businesses is a significant challenge. Revenue often scales more slowly than costs in early phases. Infrastructure bills accrue monthly, while customers may still be in pilot stages. This results in negative contribution margins and high burn rates. Without discipline, rapid scaling can amplify losses.
The path to positive unit economics comes from optimization. Model compression, quantization, and batching can lower the cost per inference. Strategic use of lower-cost hardware, such as CPUs for lighter tasks, can also be beneficial. Some firms pursue vertical integration, building proprietary chips or partnering for preferential GPU pricing. Others use caching and heuristic layers to reduce the number of repeated inference calls.
Cash efficiency improves as AI companies move from experimentation to productization. Once a model stabilizes and workload patterns become predictable, cost forecasting and margin planning become more reliable. CFOs must carefully time their fundraising and growth, ensuring the company does not overbuild infrastructure before demand materializes.
Pricing Strategies
AI pricing remains an evolving art. Standard models include pay-per-use, subscription tiers with usage caps, or hybrid pricing that blends base access fees with variable usage charges. The proper structure depends on the predictability of usage, customer willingness to pay, and cost volatility.
Usage-based pricing aligns revenue with cost but increases forecasting uncertainty. Subscription pricing provides stability but can lead to margin compression if usage spikes. CFOs often employ blended approaches, utilizing base subscriptions that cover average usage, with additional fees for exceeding demand. This provides a buffer against runaway costs while maintaining customer flexibility.
Transparent pricing is crucial. Customers need clarity about what drives cost. Complexity breeds disputes and churn. Finance leaders should collaborate with product and sales teams to develop pricing models that are straightforward, equitable, and profitable. Scenario modeling helps anticipate edge cases where heavy usage erodes margins.
Valuation and Investor Perspective
Investors evaluate AI companies through a different lens than SaaS. Because AI is still an emerging field, investors look beyond current profitability and focus on technical moats, data advantages, and the scalability of cost curves. A strong AI company demonstrates three things:
- Proprietary Model or Data: Access to unique data sets or model architectures that competitors cannot easily replicate.
- Cost Curve Mastery: A clear path to reducing cost per inference as scale grows.
- Market Pull: Evidence of real-world demand and willingness to pay for intelligence-driven outcomes.
Valuations often blend software multiples with hardware-like considerations. Early AI firms may be valued at 6 to 10 times forward revenue if they show strong growth and clear cost reduction plans. Companies perceived as purely research-driven, without commercial traction, face steeper discounts. Investors are increasingly skeptical of hype and now seek proof of sustainable margins.
In diligence, investors focus on gross margin trajectory, data defensibility, and customer concentration. They ask questions like: How fast is the cost per inference declining? What portion of revenue comes from repeat customers? How dependent is the business on third-party models or infrastructure? The CFO’s job is to prepare crisp, data-backed answers.
Measuring Efficiency and Scale
AI CFOs must introduce new forms of cost accounting. Traditional SaaS dashboards that focus solely on ARR and churn are insufficient. AI demands metrics that link compute usage to financial outcomes. Examples include:
- Compute Utilization Rate: Percentage of GPU capacity effectively used.
- Model Reuse Ratio: Number of applications or customers served by a single trained model.
- Cost per Output Unit: Expense per generated item, prediction, or token.
By tying these technical metrics to revenue and gross margin, CFOs can guide engineering priorities. Finance becomes a strategic partner in improving efficiency, not just reporting cost overruns. In a later article, we will discuss complexity and Scale. I am writing a book on that subject, and this is highly relevant to how AI-based businesses are evolving. It is expected to be released by late February next year and will be available on Kindle as an e-book.
Risk Management and Uncertainty
AI companies face unique risks. Dependence on external cloud providers introduces pricing and supply risks. Regulatory scrutiny over data usage can limit access to models or increase compliance costs. Rapid technological shifts may render models obsolete before their amortization is complete. CFOs must build contingency plans, diversify infrastructure partners, and maintain agile capital allocation processes.
Scenario planning is essential. CFOs should model high, medium, and low usage cases with corresponding cost structures. Sensitivity analysis on cloud pricing, GPU availability, and demand elasticity helps avoid surprises. Resilience matters as much as growth.
The Path Forward
For AI companies, the journey to sustainable economics is one of learning curves. Every technical improvement that reduces the cost per unit enhances the margin. Every dataset that improves model accuracy also enhances customer retention. Over time, these compounding efficiencies create leverage like SaaS, but the path is steeper.
CFOs must view AI as a cost-compression opportunity. The winners will not simply have the best models but the most efficient ones. Investors will increasingly value businesses that show declining cost curves, strong data moats, and precise product-market fit.
For CEOs, the message is focus. Building every model from scratch or chasing every vertical can drain capital. The best AI firms choose their battles wisely, investing deeply in one or two defensible areas. Finance leaders play a crucial role in guiding these choices with evidence, rather than emotion.
In summary, pure AI companies operate in a world where scale is earned, not assumed. The economics are challenging but not insurmountable. With disciplined pricing, rigorous cost tracking, and clear communication to investors, AI businesses can evolve from capital-intensive experiments into enduring, high-margin enterprises. The key is turning intelligence into economics and tackling it one inference at a time.
Part III: SaaS + AI Hybrid Models: Economics and Investor Lens
In today’s market, most SaaS companies are no longer purely software providers. They are becoming intelligence platforms, integrating artificial intelligence into their products to enhance customer value. These hybrid models combine the predictability of SaaS with the innovation of AI. They hold great promises, but they also introduce new complexities in economics, margin structure, and investor expectations. For CFOs and CEOs, the challenge is not just understanding how these elements coexist but managing them in harmony to deliver profitable growth.
The hybrid SaaS-AI model is not simply the sum of its parts. It requires balancing two different economic engines: one that thrives on recurring, high-margin revenue and another that incurs variable costs linked to compute usage. The key to success lies in recognizing where AI enhances value and where it risks eroding profitability. Leaders who can measure, isolate, and manage these dynamics can unlock superior economics and investor confidence.
The Nature of Hybrid SaaS-AI Businesses
A hybrid SaaS-AI company starts with a core subscription-based platform. Customers pay recurring fees for access, support, and updates. Additionally, the company leverages AI-powered capabilities to enhance automation, personalization, analytics, and decision-making. These features can be embedded into existing workflows or offered as add-ons, sometimes billed based on usage.
Examples include CRMs with AI-assisted forecasting, HR platforms with intelligent candidate screening, or project tools with predictive insights. In each case, AI transforms user experience and perceived value, but it also introduces incremental cost per transaction. Every inference call, data model query, or real-time prediction consumes compute power and storage.
This hybridization reshapes the traditional SaaS equation. Revenue predictability remains strong due to base subscriptions, but gross margins become more variable. CFOs must now consider blended margins and segment economics. The task is to ensure that AI features expand total lifetime value faster than they inflate cost-to-serve.
Dual Revenue Streams and Pricing Design
Hybrid SaaS-AI companies often operate with two complementary revenue streams:
- Subscription Revenue: Fixed or tiered recurring revenue, predictable and contract-based.
- Usage-Based Revenue: Variable income tied to AI consumption, such as per query, token, or transaction.
This dual model offers flexibility. Subscriptions provide stability, while usage-based revenue captures upside from heavy engagement. However, it also complicates forecasting. CFOs must model revenue variance under various usage scenarios and clearly communicate these assumptions to the Board and investors.
Pricing design becomes a strategic lever. Some firms include AI features in premium tiers to encourage upgrades. Others use consumption pricing, passing compute costs directly to customers. The right approach depends on customer expectations, cost structure, and product positioning. For enterprise markets, predictable pricing is often a preferred option. For developer- or API-driven products, usage-based pricing aligns better with the delivery of value.
The most effective hybrid models structure pricing so that incremental revenue per usage exceeds incremental cost per usage. This ensures positive unit economics across both streams. Finance teams should run sensitivity analyses to test break-even points and adjust thresholds as compute expenses fluctuate.
Gross Margin Bifurcation
Gross margin in hybrid SaaS-AI companies must be analyzed in two layers:
- SaaS Core Margin: Typically, 75 to 85 percent is driven by software delivery, hosting, and support.
- AI Layer Margin: Often 40 to 60 percent, and it depends on compute efficiency and pricing.
When blended, the total margin may initially decline, especially if AI usage grows faster than subscription base revenue. The risk is that rising compute costs erode profitability before pricing can catch up. To manage this, CFOs should report segmented gross margins to the Board. This transparency helps avoid confusion when consolidated margins fluctuate.
The goal is not to immediately maximize blended margins, but to demonstrate a credible path toward margin expansion through optimization. Over time, as AI models become more efficient and the cost per inference declines, blended margins can recover. Finance teams should measure and communicate progress in terms of margin improvement per usage unit, not just overall percentages.
Impact on Customer Economics
AI features can materially improve customer economics. They increase stickiness, reduce churn, and create opportunities for upsell. A customer who utilizes AI-driven insights or automation tools is more likely to renew, as the platform becomes an integral part of their workflow. This improved retention directly translates into a higher lifetime value.
In some cases, AI features can also justify higher pricing or premium tiers. The key is measurable value. Customers pay more when they see clear ROI: for example, faster decision-making, labor savings, or improved accuracy. CFOs should work with product and customer success teams to quantify these outcomes and use them in renewal and pricing discussions.
The critical financial question is whether AI-enhanced LTV grows faster than CAC and variable cost. If so, AI drives profitable growth. If not, it becomes an expensive feature rather than a revenue engine. Regular cohort analysis helps ensure that AI adoption is correlated with improved unit economics.
Operating Leverage and Efficiency
Hybrid SaaS-AI companies must rethink operating leverage. Traditional SaaS gains leverage by spreading fixed costs over recurring revenue. In contrast, AI introduces variable costs tied to usage. This weakens the traditional leverage model. To restore it, finance leaders must focus on efficiency levers within AI operations.
Techniques such as caching, batching, and model optimization can reduce compute costs per request. Partnering with cloud providers for reserved capacity or leveraging model compression can further improve cost efficiency. The finance team’s role is to quantify these savings and ensure engineering priorities align with economic goals.
Another form of leverage comes from data reuse. The more a single model or dataset serves multiple customers or use cases, the higher the effective ROI on data and training investment. CFOs should track data utilization ratios and model reuse metrics as part of their financial dashboards.
Cash Flow and Capital Planning
Cash flow in hybrid businesses depends on the balance between stable subscription inflows and variable infrastructure outflows. CFOs must forecast not only revenue but also compute consumption. During early rollout, AI usage can spike unpredictably, leading to cost surges. Scenario planning is essential. Building buffers into budgets prevents margin shocks.
Capital allocation should prioritize scalability. Investments in AI infrastructure should follow demonstrated demand, not speculative projections. Over-provisioning GPU capacity can result in unnecessary cash expenditures. Many firms start with cloud credits or pay-as-you-go models before committing to long-term leases or hardware purchases. The objective is to match the cost ramp with revenue realization.
As with SaaS, negative working capital from annual prepayments can be used to fund expansion. However, CFOs should reserve portions of this cash for compute variability and cost optimization initiatives.
Investor Perspective
Investors view hybrid SaaS-AI models with both enthusiasm and scrutiny. They appreciate the potential for differentiation and pricing power, but expect clear evidence that AI integration enhances, rather than dilutes, economics. The investment thesis often centers on three questions:
- Does AI materially increase customer lifetime value?
- Can the company sustain or improve gross margins as AI usage scales?
- Is there a clear path to efficient growth under the Rule of 40?
Companies that answer yes to all three earn premium valuations. Investors will typically apply core SaaS multiples (5 to 8 times Annual Recurring Revenue, or ARR) with modest uplifts if AI features drive measurable revenue growth. However, if AI costs are poorly controlled or margins decline, valuations compress quickly.
To maintain investor confidence, CFOs must provide transparency. This includes segmented reporting, sensitivity scenarios, and clear explanations of cost drivers. Investors want to see not just innovation, but financial stewardship.
Strategic Positioning
The strategic role of AI within a SaaS company determines how investors perceive it. There are three broad positioning models:
- AI as a Feature: Enhances existing workflows but is not core to monetization. Example: an email scheduling tool with AI suggestions.
- AI as a Co-Pilot: Drives user productivity and becomes central to customer experience. Example: CRM with AI-generated insights.
- AI as a Platform: Powers entire ecosystems and opens new revenue lines. Example: a developer platform offering custom AI models.
Each model carries different costs and pricing implications. CFOs should ensure that the company’s financial model aligns with its strategic posture. A feature-based AI approach should be margin-accretive. A platform-based approach may accept lower margins initially in exchange for future ecosystem revenue.
Risk Management and Governance
Hybrid models also introduce new risks. Data privacy, model bias, and regulatory compliance can create unexpected liabilities. CFOs must ensure robust governance frameworks are in place. Insurance, audit, and legal teams should work closely together to manage exposure effectively. Transparency in AI decision-making builds customer trust and reduces reputational risk.
Another risk is dependency on third-party models or APIs. Companies that use external large language models face risks related to cost and reliability. CFOs should evaluate the total cost of ownership between building and buying AI capabilities. Diversifying across providers or developing proprietary models can mitigate concentration risk.
The CFO’s Role
In hybrid SaaS-AI organizations, the CFO’s role expands beyond financial reporting. Finance becomes the integrator of technology, strategy, and economics. The CFO must help design pricing strategies, measure the cost-to-serve, and effectively communicate value to investors. This requires fluency in both financial and technical language.
Regular dashboards should include metrics such as blended gross margin, compute cost per user, AI utilization rate, and LTV uplift resulting from AI adoption. This data-driven approach allows management to make informed trade-offs between innovation and profitability.
The CFO also acts as an educator. Boards and investors may not yet be familiar with AI-driven cost structures. Clear, simple explanations build confidence and support strategic decisions.
The Path Forward
The future belongs to companies that combine SaaS predictability with AI intelligence. Those who succeed will treat AI not as a novelty but as an economic engine. They will manage AI costs with the same rigor they apply to headcount or cloud spend. They will design pricing that reflects value creation, not just usage volume. And they will communicate to investors how each new AI feature strengthens the overall financial model.
Hybrid SaaS-AI companies occupy the forefront of modern business economics. They demonstrate that innovation and discipline are not opposites, but they are partners working toward a common objective. For CFOs and CEOs, the path forward is clear: measure what matters, value price, and guide the organization with transparency and foresight. Over time, this combination of creativity and control will separate enduring leaders from experimental wanderers.
Summary
In every business model, clarity around unit economics forms the foundation for sound decision-making. Whether one is building a SaaS company, an AI company, or a hybrid of both, understanding how revenue and costs behave at the most granular level allows management to design operations and financial models that scale intelligently. Without that clarity, growth becomes noise and is not sustainable.
From years of working across SaaS businesses, I have seen firsthand how the model rewards discipline. Predictable recurring revenue, high gross margins, and scalable operating leverage create a compounding effect when managed carefully. The challenge lies in balancing acquisition cost, retention, and cash efficiency, so that each new unit of growth strengthens rather than strains the business.
In AI, the economic story changes. Here, each unit of output incurs tangible costs, such as computation, data, and inference. The path to profitability lies not in volume alone, but in mastering the cost curve. Efficiency, model reuse, and pricing alignment become as critical as sales growth. AI firms must show investors that scaling demand will compress, not inflate, the cost per unit. I have no clue how they intend to do that with GPU demand going through the roof, but in this article, let us assume for giggles that there will be a light at the end of the tunnel, and GPU costs will temper down so it can fuel AI-driven business.
For hybrid SaaS-AI businesses, success depends on integration. AI should deepen customer value, expand lifetime revenue, and justify incremental costs. CFOs and CEOs must manage dual revenue streams, measure blended margins, and communicate transparently with investors about both the promise and the trade-offs of AI adoption.
Ultimately, understanding economics is knowing the truth. I am an economist, and I like to think I am unbiased. It enables leaders to align ambition with reality and design financial models that convey a credible narrative. As the lines between SaaS and AI continue to blur, those who understand the economics underlying innovation will be best equipped to build companies that endure.
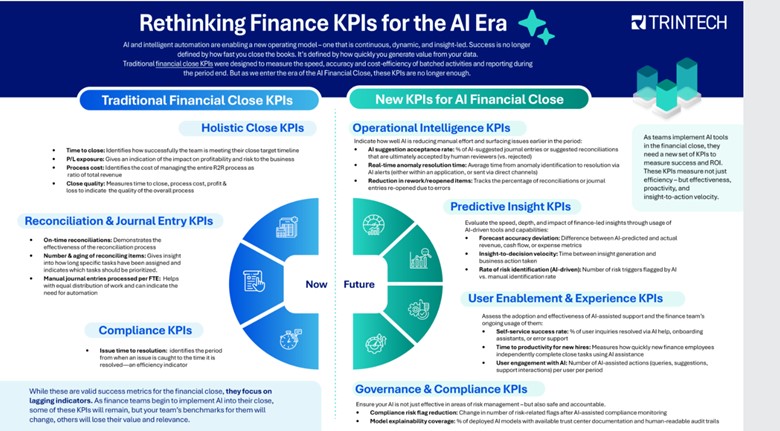
AI and the Evolving Role of CFOs
For much of the twentieth century, the role of the Chief Financial Officer was understood in familiar terms. A steward of control. A master of precision. A guardian of the balance sheet. The CFO was expected to be meticulous, cautious, and above all, accountable. Decisions were made through careful deliberation. Assumptions were scrutinized. Numbers did not lie; they merely required interpretation. There was an art to the conservatism and a quiet pride in it. Order, after all, was the currency of good finance.
Then artificial intelligence arrived—not like a polite guest knocking at the door, but more like a storm bursting through the windows, unsettling assumptions, and rewriting the rules of what it means to manage the financial function. Suddenly, the world of structured inputs and predictable outputs became a dynamic theater of probabilities, models, and machine learning loops. The close of the quarter, once a ritual of discipline and human labor, was now something that could be shortened by algorithms. Forecasts, previously the result of sleepless nights and spreadsheets, could now be generated in minutes. And yet, beneath the glow of progress, a quieter question lingered in the minds of financial leaders: Are we still in control?
The paradox is sharp. AI promises greater accuracy, faster insights, and efficiencies that were once unimaginable. But it also introduces new vulnerabilities. Decisions made by machines cannot always be explained by humans. Data patterns shift, and models evolve in ways that are hard to monitor, let alone govern. The very automation that liberates teams from tedious work may also obscure how decisions are being made. For CFOs, whose role rests on the fulcrum of control and transparency, this presents a challenge unlike any other.
To understand what is at stake, one must first appreciate the philosophical shift taking place. Traditional finance systems were built around rules. If a transaction did not match a predefined criterion, it was flagged. If a value exceeded a threshold, it triggered an alert. There was a hierarchy to control. Approvals, audits, reconciliations—all followed a chain of accountability. AI, however, does not follow rules in the conventional sense. It learns patterns. It makes predictions. It adjusts based on what it sees. In place of linear logic, it offers probability. In place of rules, it gives suggestions.
This does not make AI untrustworthy, but it does make it unfamiliar. And unfamiliarity breeds caution. For CFOs who have spent decades refining control environments, AI is not merely a tool. It is a new philosophy of decision-making. And it is one that challenges the muscle memory of the profession.
What, then, does it mean to stay in control in an AI-enhanced finance function? It begins with visibility. CFOs must ensure that the models driving key decisions—forecasts, risk assessments, working capital allocations—are not black boxes. Every algorithm must come with a passport. What data went into it? What assumptions were made? How does it behave when conditions change? These are not technical questions alone. They are governance questions. And they sit at the heart of responsible financial leadership.
Equally critical is the quality of data. An AI model is only as reliable as the information it consumes. Dirty data, incomplete records, or inconsistent definitions can quickly derail the most sophisticated tools. In this environment, the finance function must evolve from being a consumer of data to a custodian of it. The general ledger, once a passive repository of transactions, becomes part of a living data ecosystem. Consistency matters. Lineage matters. And above all, context matters. A forecast that looks brilliant in isolation may collapse under scrutiny if it was trained on flawed assumptions.
But visibility and data are only the beginning. As AI takes on more tasks that were once performed by humans, the traditional architecture of control must be reimagined. Consider the principle of segregation of duties. In the old world, one person entered the invoice, another approved it, and a third reviewed the ledger. These checks and balances were designed to prevent fraud, errors, and concentration of power. But what happens when an AI model is performing all three functions? Who oversees the algorithm? Who reviews the reviewer?
The answer is not to retreat from automation, but to introduce new forms of oversight. CFOs must create protocols for algorithmic accountability. This means establishing thresholds for machine-generated recommendations, building escalation paths for exceptions, and defining moments when human judgement must intervene. It is not about mistrusting the machine. It is about ensuring that the machine is governed with the same discipline once reserved for people.
And then there is the question of resilience. AI introduces new dependencies—on data pipelines, on cloud infrastructures, on model stability. A glitch in a forecasting model could ripple through the entire enterprise plan. A misfire in an expense classifier could disrupt a close. These are not hypothetical risks. They are operational realities. Just as organizations have disaster recovery plans for cyber breaches or system outages, they must now develop contingency plans for AI failures. The models must be monitored. The outputs must be tested. And the humans must be prepared to take over when the automation stumbles.
Beneath all of this, however, lies a deeper cultural transformation. The finance team of the future will not be composed solely of accountants, auditors, and analysts. It will also include data scientists, machine learning specialists, and process architects. The rhythm of work will shift—from data entry and manual reconciliations to interpretation, supervision, and strategic advising. This demands a new kind of fluency. Not necessarily the ability to write code, but the ability to understand how AI works, what it can do, and where its boundaries lie.
This is not a small ask. It requires training, cross-functional collaboration, and a willingness to challenge tradition. But it also opens the door to a more intellectually rich finance function—one where humans and machines collaborate to generate insights that neither could have achieved alone.
If there is a guiding principle in all of this, it is that control does not mean resisting change. It means shaping it. For CFOs, the task is not to retreat into spreadsheets or resist the encroachment of algorithms. It is to lead the integration of intelligence into every corner of the finance operation. To set the standards, define the guardrails, and ensure that the organization embraces automation not as a surrender of responsibility, but as an evolution of it.
Because in the end, the goal is not simply to automate. It is to augment. Not to replace judgement, but to elevate it. Not to remove the human hand from finance, but to position it where it matters most: at the helm, guiding the ship through faster currents, with clearer vision and steadier hands.
Artificial intelligence may never match the emotional weight of human intuition. It may not understand the stakes behind a quarter’s earnings or the subtle implications of a line item in a note to shareholders. But it can free up time. It can provide clarity. It can make the financial function faster, more adaptive, and more resilient.
And if the CFO of the past was a gatekeeper, the CFO of the future will be a choreographer—balancing risk and intelligence, control and creativity, all while ensuring that the numbers, no matter how complex their origin, still tell a story that is grounded in truth.
The machines are here. They are learning. And they are listening. The challenge is not to contain them, but to guide them—thoughtfully, carefully, and with the discipline that has always defined great finance.
Because in this new world, control is not lost. It is simply redefined.

The Power of Customer Lifetime Value in Modern Business
In contemporary business discourse, few metrics carry the strategic weight of Customer Lifetime Value (CLV). CLV and CAC are prime metrics. For modern enterprises navigating an era defined by digital acceleration, subscription economies, and relentless competition, CLV represents a unifying force, uniting finance, marketing, and strategy into a single metric that measures not only transactions but also the value of relationships. Far more than a spreadsheet calculation, CLV crystallizes lifetime revenue, loyalty, referral impact, and long-term financial performance into a quantifiable asset.
This article explores CLV’s origins, its mathematical foundations, its role as a strategic North Star across organizational functions, and the practical systems required to integrate it fully into corporate culture and capital allocation. It also highlights potential pitfalls and ethical implications.
I. CLV as a Cross-Functional Metric
CLV evolved from a simple acknowledgement: not all customers are equally valuable, and many businesses would prosper more by nurturing relationships than chasing clicks. The transition from single-sale tallies to lifetime relationship value gained momentum with the rise of subscription models—telecom plans, SaaS platforms, and membership programs—where the fiscal significance of recurring revenue became unmistakable.
This shift reframed capital deployment and decision-making:
- Marketing no longer seeks volume unquestioningly but targets segments with high long-term value.
- Finance integrates CLV into valuation models and capital allocation frameworks.
- Strategy uses it to guide M&A decisions, pricing stratagems, and product roadmap prioritization.
Because CLV is simultaneously a financial measurement and a customer-centric tool, it builds bridges—translating marketing activation into board-level impact.
II. How to calculate CLV
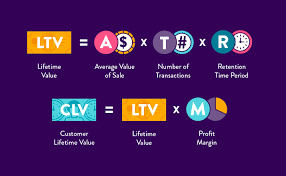
At its core, CLV employs economic modeling similar to net present value. A basic formula:
CLV = ∑ (t=0 to T) [(Rt – Ct) / (1 + d)^t]
- Rt = revenue generated at time t
- Ct = cost to serve/acquire at time t
- d = discount rate
- T = time horizon
This anchors CLV in well-accepted financial principles: discounted future cash flows, cost allocation, and multi-period forecasting. It satisfies CFO requirements for rigor and measurability.
However, marketing leaders often expand this to capture:
- Referral value (Rt includes not just direct sales, but influenced purchases)
- Emotional or brand-lift dimensions (e.g., window customers who convert later)
- Upselling, cross-selling, and tiered monetization over time
These expansions refine CLV into a dynamic forecast rather than a static average—one that responds to segmentation and behavioral triggers.
III. CLV as a Board-Level Metric
A. Investment and Capital Prioritization
Traditional capital decisions rely on ROI, return on invested capital (ROIC), and earnings multiples. CLV adds nuance: it gauges not only immediate returns but extended client relationships. This enables an expanded view of capital returns.
For example, a company might shift budget from low-CLV acquisition channels to retention-focused strategies—investing more in on-boarding, product experience, or customer success. These initiatives, once considered costs, now become yield-generating assets.
B. Segment-Based Acquisition
CLV enables precision targeting. A segment that delivers a 6:1 lifetime value-to-acquisition-cost (LTV:CAC) ratio is clearly more valuable than one delivering 2:1. Marketing reallocates spend accordingly, optimizing strategic segmentation and media mix, tuning messaging for high-value cohorts.
Because CLV is quantifiable and forward-looking, it naturally aligns marketing decisions with shareholder-driven metrics.
C. Tiered Pricing and Customer Monetization
CLV is also central to monetization strategy. Churn, upgrade rates, renewal behaviors, and pricing power all can be evaluated through the lens of customer value over time. Versioning, premium tiers, loyalty benefits—all become levers to maximize lifetime value. Finance and strategy teams model these scenarios to identify combinations that yield optimal returns.
D. Strategic Partnerships and M&A
CLV informs deeper decisions about partnerships and mergers. In evaluating a potential platform acquisition, projected contribution to overall CLV may be a decisive factor, especially when combined customer pools or cross-sell ecosystems can amplify lifetime revenue. It embeds customer value insights into due diligence and valuation calculations.
IV. Organizational Integration: A Strategic Imperative
Effective CLV deployment requires more than good analytics—it demands structural clarity and cultural alignment across three key functions.
A. Finance as Architect
Finance teams frame the assumptions—discount rates, cost allocation, margin calibration—and embed CLV into broader financial planning and analysis. Their task: convert behavioral data and modeling into company-wide decision frameworks used in investment reviews, budgeting, and forecasting processes.
B. Marketing as Activation Engine
Marketing owns customer acquisition, retention campaigns, referral programs, and product messaging. Their role is to feed the CLV model with real data: conversion rates, churn, promotion impact, and engagement flows. In doing so, campaigns become precision tools tuned to maximize customer yield rather than volume alone.
C. Strategy as Systems Designer
The strategy team weaves CLV outputs into product roadmaps, pricing strategy, partnership design, and geographic expansion. Using CLV foliated by cohort and channel, strategy leaders can sequence investments to align with long-term margin objectives—such as a five-year CLV-driven revenue mix.
V. Embedding CLV Into Corporate Processes
The following five practices have proven effective at embedding CLV into organizational DNA:
- Executive Dashboards
Incorporate LTV:CAC ratios, cohort retention rates, and segment CLV curves into executive reporting cycles. Tie leadership incentives (e.g., bonuses, compensation targets) to long-term value outcomes. - Cross-Functional CLV Cells
Establish CLV analytics teams staffed by finance, marketing insights, and data engineers. They own CLV modeling, simulation, and distribution across functions. - Monthly CLV Reviews
Monthly orchestration meetings integrate metrics updates, marketing feedback on campaigns, pricing evolution, and retention efforts. Simultaneous adjustment across functions allows dynamic resource allocation. - Capital Allocation Gateways
Projects involving customer-facing decisions—from new products to geographic pullbacks—must include CLV impact assessments in gating criteria. These can also feed into product investment requests and ROI thresholds. - Continuous Learning Loops
CLV models must be updated with actual lifecycle data. Regular recalibration fosters learning from retention behaviors, pricing experiments, churn drivers, and renewal rates—fueling confidence in incremental decision-making.
VI. Caveats and Limitations
CLV, though powerful, is not a cure-all. These caveats merit attention:
- Data Quality: Poorly integrated systems, missing customer identifiers, or inconsistent cohort logic can produce misleading CLV metrics.
- Assumption Risk: Discount rates, churn decay, turnaround behavior—all are model assumptions. Unqualified confidence can mislead investment.
- Narrow Focus: High CLV may chronically favor established segments, leaving growth through new markets or products underserved.
- Over-Targeting Risk: Over-optimizing for short-term yield may harm brand reputation or equity with broader audiences.
Therefore, CLV must be treated with humility—an advanced tool requiring discipline in measurement, calibration, and multi-dimensional insight.
VII. The Influence of Digital Ecosystems
Modern digital ecosystems deliver immense granularity. Every interaction—click, open, referral, session length—is measurable. These dark data provide context for CLV testing, segment behavior, and risk triggers.
However, this scale introduces overfitting risk: spurious correlations may override structural signals. Successful organizations maintain a balance—leveraging high-frequency signals for short-cycle interventions, while retaining medium-term cohort logic for capital allocation and strategic initiatives.
VIII. Ethical and Brand Implications
“CLV”, when viewed through a values lens, also becomes a cultural and ethical marker. Decisions informed by CLV raise questions:
- To what extent should a business monetize a cohort? Is excessive monetization ethical?
- When loyalty programs disproportionately reward high-value customers, does brand equity suffer among moderate spenders?
- When referral bonuses attract opportunists rather than advocates, is brand authenticity compromised?
These considerations demand that CLV strategies incorporate brand and ethical governance, not just financial optimization.
IX. Cross-Functionally Harmonized Governance
A robust operating model to sustain CLV alignment should include:
- Structured Metrics Governance: Common cohort definitions, discount rates, margin allocation, and data timelines maintained under joint sponsorship.
- Integrated Information Architecture: Real-time reporting, defined data lineage (acquisition to LTV), and cross-functional access.
- Quarterly Board Oversight: Board-level dashboards that track digital customer performance and CLV trends as fundamental risk and opportunity signals.
- Ethical Oversight Layer: Cross-functional reviews ensuring CLV-driven decisions don’t undermine customer trust or brand perception.
X. CLV as Strategic Doctrine
When deployed with discipline, CLV becomes more than a metric—it becomes a cultural doctrine. The essential tenets are:
- Time horizon focus: orienting decisions toward lifetime impact rather than short-cycle transactions.
- Cross-functional governance: embedding CLV into finance, marketing, and strategy with shared accountability.
- Continuous recalibration: creating feedback loops that update assumptions and reinforce trust in the metric.
- Ethical stewardship: ensuring customer relationships are respected, brand equity maintained, and monetization balanced.
With that foundation, CLV can guide everything from media budgets and pricing plans to acquisition strategy and market expansion.
Conclusion
In an age where customer relationships define both resilience and revenue, Customer Lifetime Value stands out as an indispensable compass. It unites finance’s need for systematic rigor, marketing’s drive for relevance and engagement, and strategy’s mandate for long-term value creation. When properly modeled, governed, and governed ethically, CLV enables teams to shift from transactional quarterly mindsets to lifetime portfolios—transforming customers into true franchise assets.
For any organization aspiring to mature its performance, CLV is the next frontier. Not just a metric on a dashboard—but a strategic mechanism capable of aligning functions, informing capital allocation, shaping product trajectories, elevating brand meaning, and forging relationships that transcend a single transaction.
Navigating Startup Growth: Adapting Your Operating Model Every Year
If a startup’s journey can be likened to an expedition up Everest, then its operating model is the climbing gear—vital, adaptable, and often revised. In the early stages, founders rely on grit and flexibility. But as companies ascend and attempt to scale, they face a stark and simple truth: yesterday’s systems are rarely fit for tomorrow’s challenges. The premise of this memo is equally stark: your operating model must evolve—consciously and structurally—every 12 months if your company is to scale, thrive, and remain relevant.
This is not a speculative opinion. It is a necessity borne out by economic theory, pattern recognition, operational reality, and the statistical arc of business mortality. According to a 2023 McKinsey report, only 1 in 200 startups make it to $100M in revenue, and even fewer become sustainably profitable. The cliff isn’t due to product failure alone—it’s largely an operational failure to adapt at the right moment. Let’s explore why.
1. The Law of Exponential Complexity
Startups begin with a high signal-to-noise ratio. A few people, one product, and a common purpose. Communication is fluid, decision-making is swift, and adjustments are frequent. But as the team grows from 10 to 50 to 200, each node adds complexity. If you consider the formula for potential communication paths in a group—n(n-1)/2—you’ll find that at 10 employees, there are 45 unique interactions. At 50? That number explodes to 1,225.
This isn’t just theory. Each of those paths represents a potential decision delay, misalignment, or redundancy. Without an intentional redesign of how information flows, how priorities are set, and how accountability is structured, the weight of complexity crushes velocity. An operating model that worked flawlessly in Year 1 becomes a liability in Year 3.
Lesson: The operating model must evolve to actively simplify while the organization expands.
2. The 4 Seasons of Growth
Companies grow in phases, each requiring different operating assumptions. Think of them as seasons:
| Stage | Key Focus | Operating Model Needs |
|---|---|---|
| Start-up | Product-Market Fit | Agile, informal, founder-centric |
| Early Growth | Customer Traction | Lean teams, tight loops, scalable GTM |
| Scale-up | Repeatability | Functional specialization, metrics |
| Expansion | Market Leadership | Cross-functional governance, systems |
At each transition, the company must answer: What must we centralize vs. decentralize? What metrics now matter? Who owns what? A model that optimizes for speed in Year 1 may require guardrails in Year 2. And in Year 3, you may need hierarchy—yes, that dreaded word among startups—to maintain coherence.
Attempting to scale without rethinking the model is akin to flying a Cessna into a hurricane. Many try. Most crash.
3. From Hustle to System: Institutionalizing What Works
Founders often resist operating models because they evoke bureaucracy. But bureaucracy isn’t the issue—entropy is. As the organization grows, systems prevent chaos. A well-crafted operating model does three things:
- Defines governance – who decides what, when, and how.
- Aligns incentives – linking strategy, execution, and rewards.
- Enables measurement – providing real-time feedback on what matters.
Let’s take a practical example. In the early days, a product manager might report directly to the CEO and also collaborate closely with sales. But once you have multiple product lines and a sales org with regional P&Ls, that old model breaks. Now you need Product Ops. You need roadmap arbitration based on capacity planning, not charisma.
Translation: Institutionalize what worked ad hoc by architecting it into systems.
4. Why Every 12 Months? The Velocity Argument
Why not every 24 months? Or every 6? The 12-month cadence is grounded in several interlocking reasons:
- Business cycles: Most companies operate on annual planning rhythms. You set targets, budget resources, and align compensation yearly. The operating model must match that cadence or risk misalignment.
- Cultural absorption: People need time to digest one operating shift before another is introduced. Twelve months is the Goldilocks zone—enough to evaluate results but not too long to become obsolete.
- Market feedback: Every year brings fresh feedback from the market, investors, customers, and competitors. If your operating model doesn’t evolve in step, you’ll lose your edge—like a boxer refusing to switch stances mid-fight.
And then there’s compounding. Like interest on capital, small changes in systems—when made annually—compound dramatically. Optimize decision velocity by 10% annually, and in 5 years, you’ve doubled it. Delay, and you’re crushed by organizational debt.
5. The Operating Model Canvas
To guide this evolution, we recommend using a simplified Operating Model Canvas—a strategic tool that captures the six dimensions that must evolve together:
| Dimension | Key Questions |
|---|---|
| Structure | How are teams organized? What’s centralized? |
| Governance | Who decides what? What’s the escalation path? |
| Process | What are the key workflows? How do they scale? |
| People | Do roles align to strategy? How do we manage talent? |
| Technology | What systems support this stage? Where are the gaps? |
| Metrics | Are we measuring what matters now vs. before? |
Reviewing and recalibrating these dimensions annually ensures that the foundation evolves with the building. The alternative is often misalignment, where strategy runs ahead of execution—or worse, vice versa.
6. Case Studies in Motion: Lessons from the Trenches
a. Slack (Pre-acquisition)
In Year 1, Slack’s operating model emphasized velocity of product feedback. Engineers spoke to users directly, releases shipped weekly, and product decisions were founder-led. But by Year 3, with enterprise adoption rising, the model shifted: compliance, enterprise account teams, and customer success became core to the GTM motion. Without adjusting the operating model to support longer sales cycles and regulated customer needs, Slack could not have grown to a $1B+ revenue engine.
b. Airbnb
Initially, Airbnb’s operating rhythm centered on peer-to-peer UX. But as global regulatory scrutiny mounted, they created entirely new policy, legal, and trust & safety functions—none of which were needed in Year 1. Each year, Airbnb re-evaluated what capabilities were now “core” vs. “context.” That discipline allowed them to survive major downturns (like COVID) and rebound.
c. Stripe
Stripe invested heavily in internal tooling as they scaled. Recognizing that developer experience was not only for customers but also internal teams, they revised their internal operating platforms annually—often before they were broken. The result: a company that scaled to serve millions of businesses without succumbing to the chaos that often plagues hypergrowth.
7. The Cost of Inertia
Aging operating models extract a hidden tax. They confuse new hires, slow decisions, demoralize high performers, and inflate costs. Worse, they signal stagnation. In a landscape where capital efficiency is paramount (as underscored in post-2022 venture dynamics), bloated operating models are a death knell.
Consider this: According to Bessemer Venture Partners, top quartile SaaS companies show Rule of 40 compliance with fewer than 300 employees per $100M of ARR. Those that don’t? Often have twice the headcount with half the profitability—trapped in models that no longer fit their stage.
8. How to Operationalize the 12-Month Reset
For practical implementation, I suggest a 12-month Operating Model Review Cycle:
| Month | Focus Area |
|---|---|
| Jan | Strategic planning finalization |
| Feb | Gap analysis of current model |
| Mar | Cross-functional feedback loop |
| Apr | Draft new operating model vNext |
| May | Review with Exec Team |
| Jun | Pilot model changes |
| Jul | Refine and communicate broadly |
| Aug | Train managers on new structures |
| Sep | Integrate into budget planning |
| Oct | Lock model into FY plan |
| Nov | Run simulations/test governance |
| Dec | Prepare for January launch |
This cycle ensures that your org model does not lag behind your strategic ambition. It also sends a powerful cultural signal: we evolve intentionally, not reactively.
Conclusion: Be the Architect, Not the Archaeologist
Every successful company is, at some level, a systems company. Apple is as much about its supply chain as its design. Amazon is a masterclass in operating cadence. And Salesforce didn’t win by having a better CRM—it won by continuously evolving its go-to-market and operating structure.
To scale, you must be the architect of your company’s operating future—not an archaeologist digging up decisions made when the world was simpler.
So I leave you with this conviction: operating models are not carved in stone—they are coded in cycles. And the companies that win are those that rewrite that code every 12 months—with courage, with clarity, and with conviction.
Bias and Error: Human and Organizational Tradeoff
“I spent a lifetime trying to avoid my own mental biases. A.) I rub my own nose into my own mistakes. B.) I try and keep it simple and fundamental as much as I can. And, I like the engineering concept of a margin of safety. I’m a very blocking and tackling kind of thinker. I just try to avoid being stupid. I have a way of handling a lot of problems — I put them in what I call my ‘too hard pile,’ and just leave them there. I’m not trying to succeed in my ‘too hard pile.’” : Charlie Munger — 2020 CalTech Distinguished Alumni Award interview
Bias is a disproportionate weight in favor of or against an idea or thing, usually in a way that is closed-minded, prejudicial, or unfair. Biases can be innate or learned. People may develop biases for or against an individual, a group, or a belief. In science and engineering, a bias is a systematic error. Statistical bias results from an unfair sampling of a population, or from an estimation process that does not give accurate results on average.
Error refers to a outcome that is different from reality within the context of the objective function that is being pursued.
Thus, I would like to think that the Bias is a process that might lead to an Error. However, that is not always the case. There are instances where a bias might get you to an accurate or close to an accurate result. Is having a biased framework always a bad thing? That is not always the case. From an evolutionary standpoint, humans have progressed along the dimension of making rapid judgements – and much of them stemming from experience and their exposure to elements in society. Rapid judgements are typified under the System 1 judgement (Kahneman, Tversky) which allows bias and heuristic to commingle to effectively arrive at intuitive decision outcomes.

And again, the decision framework constitutes a continually active process in how humans or/and organizations execute upon their goals. It is largely an emotional response but could just as well be an automated response to a certain stimulus. However, there is a danger prevalent in System 1 thinking: it might lead one to comfortably head toward an outcome that is seemingly intuitive, but the actual result might be significantly different and that would lead to an error in the judgement. In math, you often hear the problem of induction which establishes that your understanding of a future outcome relies on the continuity of the past outcomes, and that is an errant way of thinking although it still represents a useful tool for us to advance toward solutions.
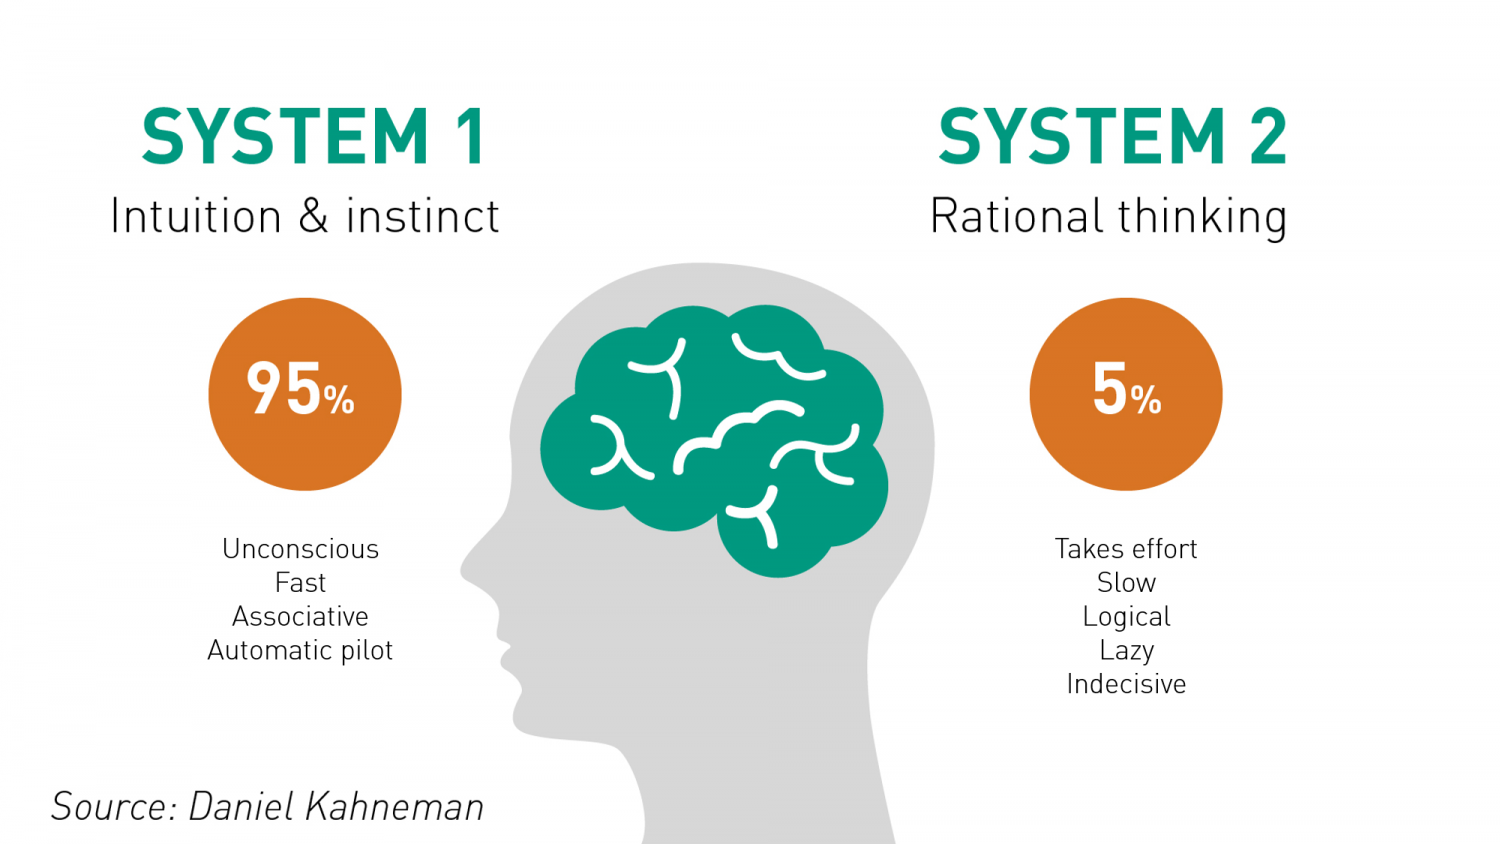
System 2 judgement emerges as another means to temper the more significant variabilities associated with System 1 thinking. System 2 thinking represents a more deliberate approach which leads to a more careful construct of rationale and thought. It is a system that slows down the decision making since it explores the logic, the assumptions, and how the framework tightly fits together to test contexts. There are a more lot more things at work wherein the person or the organization has to invest the time, focus the efforts and amplify the concentration around the problem that has to be wrestled with. This is also the process where you search for biases that might be at play and be able to minimize or remove that altogether. Thus, each of the two Systems judgement represents two different patterns of thinking: rapid, more variable and more error prone outcomes vs. slow, stable and less error prone outcomes.
So let us revisit the Bias vs. Variance tradeoff. The idea is that the more bias you bring to address a problem, there is less variance in the aggregate. That does not mean that you are accurate. It only means that there is less variance in the set of outcomes, even if all of the outcomes are materially wrong. But it limits the variance since the bias enforces a constraint in the hypotheses space leading to a smaller and closely knit set of probabilistic outcomes. If you were to remove the constraints in the hypotheses space – namely, you remove bias in the decision framework – well, you are faced with a significant number of possibilities that would result in a larger spread of outcomes. With that said, the expected value of those outcomes might actually be closer to reality, despite the variance – than a framework decided upon by applying heuristic or operating in a bias mode.
So how do we decide then? Jeff Bezos had mentioned something that I recall: some decisions are one-way street and some are two-way. In other words, there are some decisions that cannot be undone, for good or for bad. It is a wise man who is able to anticipate that early on to decide what system one needs to pursue. An organization makes a few big and important decisions, and a lot of small decisions. Identify the big ones and spend oodles of time and encourage a diverse set of input to work through those decisions at a sufficiently high level of detail. When I personally craft rolling operating models, it serves a strategic purpose that might sit on shifting sands. That is perfectly okay! But it is critical to evaluate those big decisions since the crux of the effectiveness of the strategy and its concomitant quantitative representation rests upon those big decisions. Cutting corners can lead to disaster or an unforgiving result!
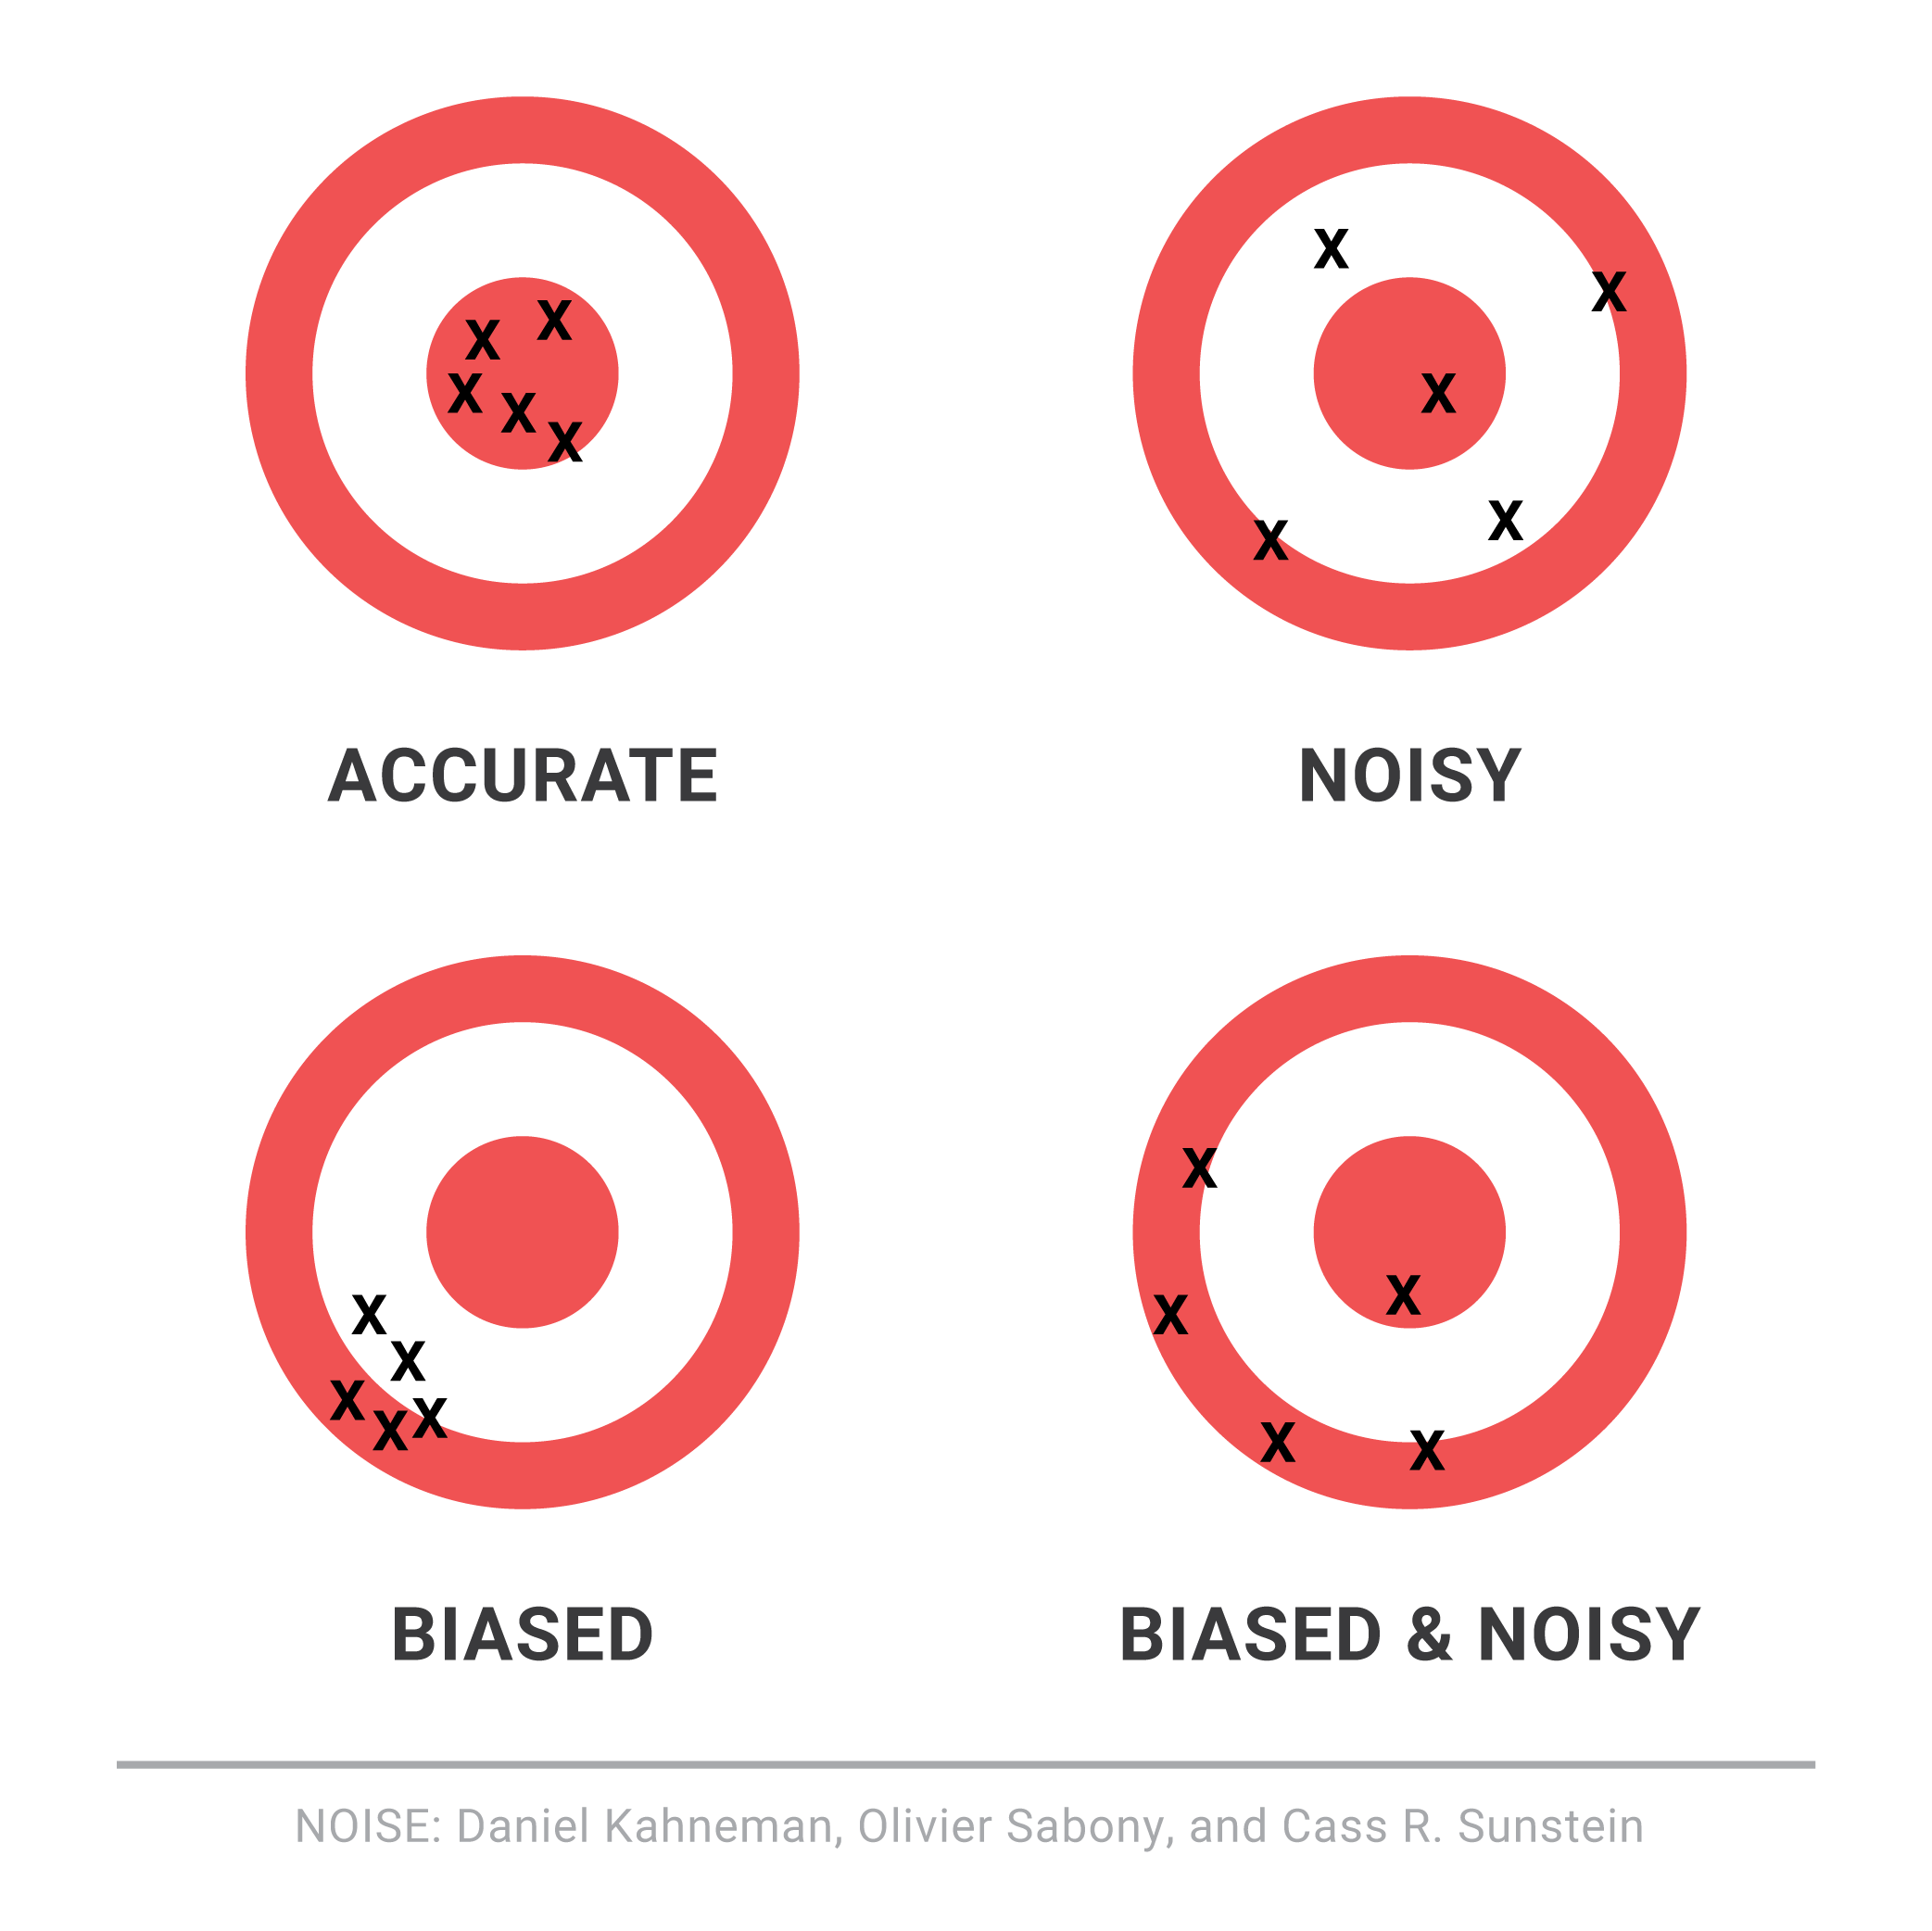
I will focus on the big whale decisions now. I will assume, for the sake of expediency, that the series of small decisions, in the aggregate or by itself, will not sufficiently be large enough that it would take us over the precipice. (It is also important however to examine the possibility that a series of small decisions can lead to a more holistic unintended emergent outcome that might have a whale effect: we come across that in complexity theory that I have already touched on in a set of previous articles).

Cognitive Biases are the biggest mea culpas that one needs to worry about. Some of the more common biases are confirmation bias, attribution bias, the halo effect, the rule of anchoring, the framing of the problem, and status quo bias. There are other cognition biases at play, but the ones listed above are common in planning and execution. It is imperative that these biases be forcibly peeled off while formulating a strategy toward problem solving.
But then there are also the statistical biases that one needs to be wary of. How we select data or selection bias plays a big role in validating information. In fact, if there are underlying statistical biases, the validity of the information is questionable. Then there are other strains of statistical biases: the forecast bias which is the natural tendency to be overtly optimistic or pessimistic without any substantive evidence to support one or the other case. Sometimes how the information is presented: visually or in tabular format – can lead to sins of the error of omission and commission leading the organization and judgement down paths that are unwarranted and just plain wrong. Thus, it is important to be aware of how statistical biases come into play to sabotage your decision framework.

One of the finest illustrations of misjudgment has been laid out by Charlie Munger. Here is the excerpt link : https://fs.blog/great-talks/psychology-human-misjudgment/ He lays out a very comprehensive 25 Biases that ail decision making. Once again, stripping biases do not necessarily result in accuracy — it increases the variability of outcomes that might be clustered around a mean that might be closer to accuracy than otherwise.
Variability is Noise. We do not know a priori what the expected mean is. We are close, but not quite. There is noise or a whole set of outcomes around the mean. Viewing things closer to the ground versus higher would still create a likelihood of accepting a false hypothesis or rejecting a true one. Noise is extremely hard to sift through, but how you can sift through the noise to arrive at those signals that are determining factors, is critical to organization success. To get to this territory, we have eliminated the cognitive and statistical biases. Now is the search for the signal. What do we do then? An increase in noise impairs accuracy. To improve accuracy, you either reduce noise or figure out those indicators that signal an accurate measure.
This is where algorithmic thinking comes into play. You start establishing well tested algorithms in specific use cases and cross-validate that across a large set of experiments or scenarios. It has been proved that algorithmic tools are, in the aggregate, superior to human judgement – since it systematically can surface causal and correlative relationships. Furthermore, special tools like principal component analysis and factory analysis can incorporate a large input variable set and establish the patterns that would be impregnable for even System 2 mindset to comprehend. This will bring decision making toward the signal variants and thus fortify decision making.
The final element is to assess the time commitment required to go through all the stages. Given infinite time and resources, there is always a high likelihood of arriving at those signals that are material for sound decision making. Alas, the reality of life does not play well to that assumption! Time and resources are constraints … so one must make do with sub-optimal decision making and establish a cutoff point wherein the benefits outweigh the risks of looking for another alternative. That comes down to the realm of judgements. While George Stigler, a Nobel Laureate in Economics, introduce search optimization in fixed sequential search – a more concrete example has been illustrated in “Algorithms to Live By” by Christian & Griffiths. They suggested an holy grail response: 37% is the accurate answer. In other words, you would reach a suboptimal decision by ensuring that you have explored up to 37% of your estimated maximum effort. While the estimated maximum effort is quite ambiguous and afflicted with all of the elements of bias (cognitive and statistical), the best thinking is to be as honest as possible to assess that effort and then draw your search threshold cutoff.
An important element of leadership is about making calls. Good calls, not necessarily the best calls! Calls weighing all possible circumstances that one can, being aware of the biases, bringing in a diverse set of knowledge and opinions, falling back upon agnostic tools in statistics, and knowing when it is appropriate to have learnt enough to pull the trigger. And it is important to cascade the principles of decision making and the underlying complexity into and across the organization.
Network Theory and Network Effects
Complexity theory needs to be coupled with network theory to get a more comprehensive grasp of the underlying paradigms that govern the outcomes and morphology of emergent systems. In order for us to understand the concept of network effects which is commonly used to understand platform economics or ecosystem value due to positive network externalities, we would like to take a few steps back and appreciate the fundamental theory of networks. This understanding will not only help us to understand complexity and its emergent properties at a low level but also inform us of the impact of this knowledge on how network effects can be shaped to impact outcomes in an intentional manner.

There are first-order conditions that must be met to gauge whether the subject of the observation is a network. Firstly, networks are all about connectivity within and between systems. Understanding the components that bind the system would be helpful. However, do keep in mind that complexity systems (CPS and CAS) might have emergent properties due to the association and connectivity of the network that might not be fully explained by network theory. All the same, understanding networking theory is a building block to understanding emergent systems and the outcome of its structure on addressing niche and macro challenges in society.

Networks operates spatially in a different space and that has been intentionally done to allow some simplification and subsequent generalization of principles. The geometry of network is called network topology. It is a 2D perspective of connectivity.
Networks are subject to constraints (physical resources, governance constraint, temporal constraints, channel capacity, absorption and diffusion of information, distribution constraint) that might be internal (originated by the system) or external (originated in the environment that the network operates in).

Finally, there is an inherent non-linearity impact in networks. As nodes increase linearly, connections will increase exponentially but might be subject to constraints. The constraints might define how the network structure might morph and how information and signals might be processed differently.
Graph theory is the most widely used tool to study networks. It consists of four parts: vertices which represent an element in the network, edges refer to relationship between nodes which we call links, directionality which refers to how the information is passed ( is it random and bi-directional or follows specific rules and unidirectional), channels that refer to bandwidth that carry information, and finally the boundary which establishes specificity around network operations. A graph can be weighted – namely, a number can be assigned to each length to reflect the degree of interaction or the strength of resources or the proximity of the nodes or the ordering of discernible clusters.
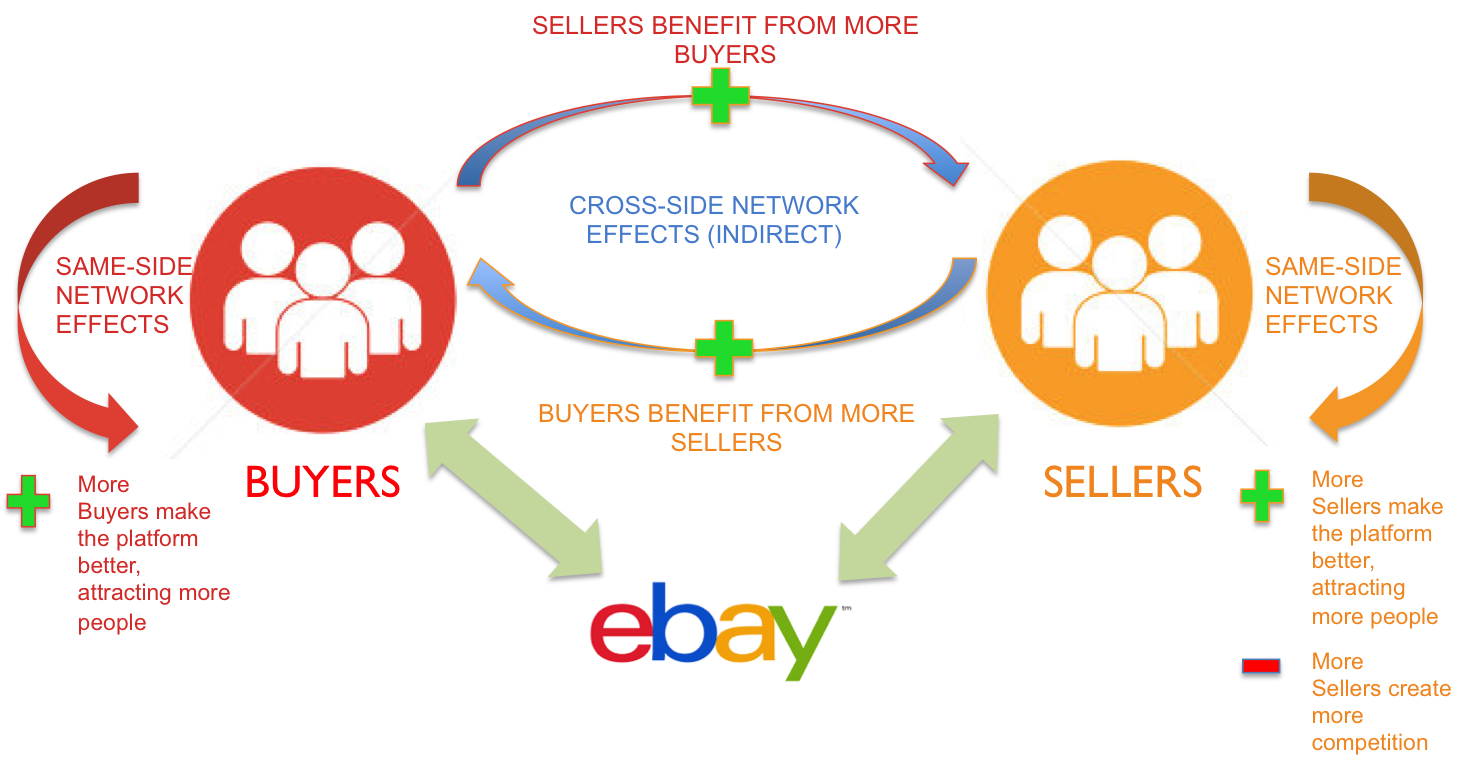
The central concept of network theory thus revolves around connectivity between nodes and how non-linear emergence occurs. A node can have multiple connections with other node/nodes and we can weight the node accordingly. In addition, the purpose of networks is to pass information in the most efficient manner possible which relays into the concept of a geodesic which is either the shortest path between two nodes that must work together to achieve a purpose or the least number of leaps through links that information must negotiate between the nodes in the network.
Technically, you look for the longest path in the network and that constitutes the diameter while you calculate the average path length by examining the shortest path between nodes, adding all of those paths up and then dividing by the number of pairs. Significance of understanding the geodesic allows an understanding of the size of the network and throughput power that the network is capable of.
Nodes are the atomic elements in the network. It is presumed that its degree of significance is related to greater number of connections. There are other factors that are important considerations: how adjacent or close are the nodes to one another, does some nodes have authority or remarkable influence on others, are nodes positioned to be a connector between other nodes, and how capable are the nodes in absorbing, processing and diffusing the information across the links or channels. How difficult is it for the agents or nodes in the network to make connections? It is presumed that if the density of the network is increased, then we create a propensity in the overall network system to increase the potential for increased connectivity.

As discussed previously, our understanding of the network is deeper once we understand the elements well. The structure or network topology is represented by the graph and then we must understand size of network and the patterns that are manifested in the visual depiction of the network. Patterns, for our purposes, might refer to clusters of nodes that are tribal or share geographical proximity that self-organize and thus influence the structure of the network. We will introduce a new term homophily where agents connect with those like themselves. This attribute presumably allows less resources needed to process information and diffuse outcomes within the cluster. Most networks have a cluster bias: in other words, there are areas where there is increased activity or increased homogeneity in attributes or some form of metric that enshrines a group of agents under one specific set of values or activities. Understanding the distribution of cluster and the cluster bias makes it easier to influence how to propagate or even dismantle the network. This leads to an interesting question: Can a network that emerges spontaneously from the informal connectedness between agents be subjected to some high dominance coefficient – namely, could there be nodes or links that might exercise significant weight on the network?
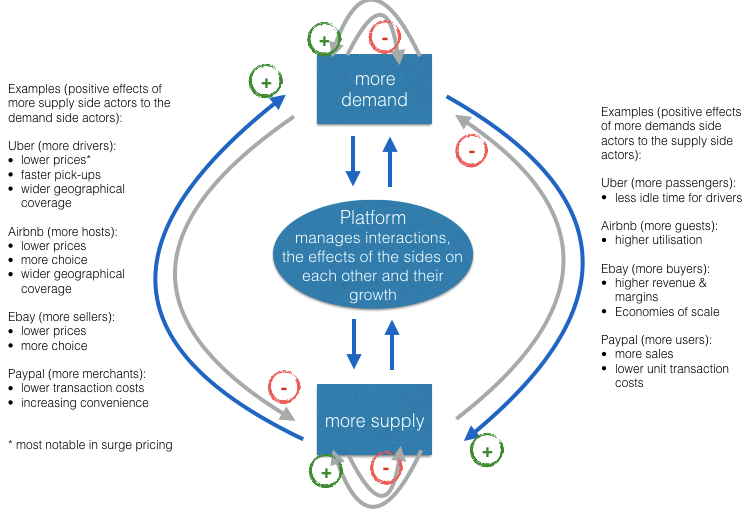
The network has to align to its environment. The environment can place constraints on the network. In some instances, the agents have to figure out how to overcome or optimize their purpose in the context of the presence of the environmental constraints. There is literature that suggests the existence of random networks which might be an initial state, but it is widely agreed that these random networks self-organize around their purpose and their interaction with its environment. Network theory assigns a number to the degree of distribution which means that all or most nodes have an equivalent degree of connectivity and there is no skewed influence being weighed on the network by a node or a cluster. Low numbers assigned to the degree of distribution suggest a network that is very democratic versus high number that suggests centralization. To get a more practical sense, a mid-range number assigned to a network constitutes a decentralized network which has close affinities and not fully random. We have heard of the six degrees of separation and that linkage or affinity is most closely tied to a mid-number assignment to the network.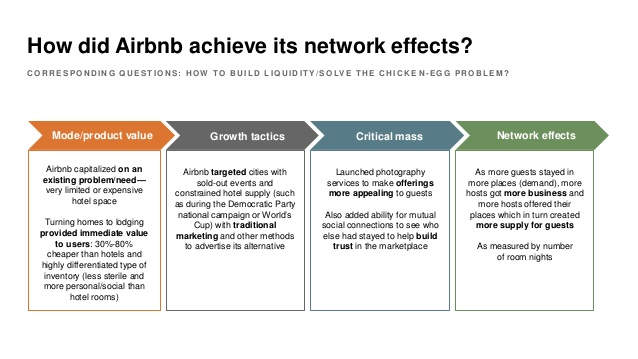
We are now getting into discussions on scale and binding this with network theory. Metcalfe’s law states that the value of a network grows as a square of the number of the nodes in the network. More people join the network, the more valuable the network. Essentially, there is a feedback loop that is created, and this feedback loop can kindle a network to grow exponentially. There are two other topics – Contagion and Resilience. Contagion refers to the ability of the agents to diffuse information. This information can grow the network or dismantle it. Resilience refers to how the network is organized to preserve its structure. As you can imagine, they have huge implications that we see. How do certain ideas proliferate over others, how does it cluster and create sub-networks which might grow to become large independent networks and how it creates natural defense mechanisms against self-immolation and destruction?

Network effect is commonly known as externalities in economics. It is an effect that is external to the transaction but influences the transaction. It is the incremental benefit gained by an existing user for each new user that joins the network. There are two types of network effects: Direct network effects and Indirect network effect. Direct network effects are same side effects. The value of a service goes up as the number of users goes up. For example, if more people have phones, it is useful for you to have a phone. The entire value proposition is one-sided. Indirect networks effects are multi-sided. It lends itself to our current thinking around platforms and why smart platforms can exponentially increase the network. The value of the service increases for one user group when a new user group joins the network. Take for example the relationship between credit card banks, merchants and consumers. There are three user groups, and each gather different value from the network of agents that have different roles. If more consumers use credit cards to buy, more merchants will sign up for the credit cards, and as more merchants sign up – more consumers will sign up with the bank to get more credit cards. This would be an example of a multi-sided platform that inherently has multi-sided network effects. The platform inherently gains significant power such that it becomes more valuable for participants in the system to join the network despite the incremental costs associated with joining the network. Platforms that are built upon effective multi-sided network effects grow quickly and are generally sustainable. Having said that, it could be just as easy that a few dominant bad actors in the network can dismantle and unravel the network completely. We often hear of the tipping point: namely, that once the platform reaches a critical mass of users, it would be difficult to dismantle it. That would certainly be true if the agents and services are, in the aggregate, distributed fairly across the network: but it is also possible that new networks creating even more multi-sided network effects could displace an entrenched network. Hence, it is critical that platform owners manage the quality of content and users and continue to look for more opportunities to introduce more user groups to entrench and yet exponentially grow the network.

Winner Take All Strategy
Being the first to cross the finish line makes you a winner in only one phase of life. It’s what you do after you cross the line that really counts.
– Ralph Boston
Does winner-take-all strategy apply outside the boundaries of a complex system? Let us put it another way. If one were to pursue a winner-take-all strategy, then does this willful strategic move not bind them to the constraints of complexity theory? Will the net gains accumulate at a pace over time far greater than the corresponding entropy that might be a by-product of such a strategy? Does natural selection exhibit a winner-take-all strategy over time and ought we then to regard that winning combination to spur our decisions around crafting such strategies? Are we fated in the long run to arrive at a world where there will be a very few winners in all niches and what would that mean? How does that surmise with our good intentions of creating equal opportunities and a fair distribution of access to resources to a wider swath of the population? In other words, is a winner take all a deterministic fact and does all our trivial actions to counter that constitute love’s labor lost?

Natural selection is a mechanism for evolution. It explains how populations or species evolve or modify over time in such a manner that it becomes better suited to their environments. Recall the discussion on managing scale in the earlier chapter where we discussed briefly about aligning internal complexity to external complexity. Natural selection is how it plays out at a biological level. Essentially natural selection posits that living organisms have inherited traits that help them to survive and procreate. These organisms will largely leave more offspring than their peers since the presumption is that these organisms will carry key traits that will survive the vagaries of external complexity and environment (predators, resource scarcity, climate change, etc.) Since these traits are passed on to the next generate, these traits will become more common until such time that the traits are dominant over generations, if the environment has not been punctuated with massive changes. These organisms with these dominant traits will have adapted to their environment. Natural selection does not necessarily suggest that what is good for one is good for the collective species.
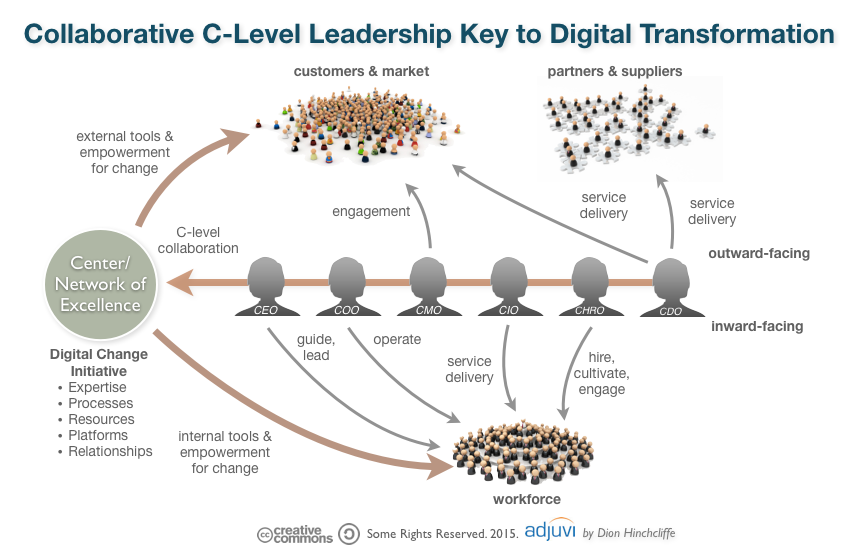
An example that was shared by Robert Frank in his book “The Darwin Economy” was the case of large antlers of the bull elk. These antlers developed as an instrument for attracting mates rather than warding off predators. Big antlers would suggest a greater likelihood of the bull elk to marginalize the elks with smaller antlers. Over time, the bull elks with small antlers would die off since they would not be able to produce offspring and pass their traits. Thus, the bull elks would largely comprise of those elks with large antlers. However, the flip side is that large antlers compromise mobility and thus are more likely to be attacked by predators. Although the individual elk with large antler might succeed to stay around over time, it is also true that the compromised mobility associated with large antlers would overall hurt the propagation of the species as a collective group. We will return to this very important concept later. The interests of individual animals were often profoundly in conflict with the broader interests of their own species. Corresponding to the development of the natural selection mechanism is the introduction of the concept of the “survival of the fittest” which was introduced by Herbert Spencer. One often uses natural selection and survival of the fittest interchangeable and that is plain wrong. Natural selection never claims that the species that will emerge is the strongest, the fastest, the largest, etc.: it simply claims that the species will be the fittest, namely it will evolve in a manner best suited for the environment in which it resides. Put it another way: survival of the most sympathetic is perhaps more applicable. Organisms that are more sympathetic and caring and work in harmony with the exigencies of an environment that is largely outside of their control would likely succeed and thrive.

We will digress into the world of business. A common conception that is widely discussed is that businesses must position toward a winner-take-all strategy – especially, in industries that have very high entry costs. Once these businesses entrench themselves in the space, the next immediate initiative would be to literally launch a full-frontal assault involving huge investments to capture the mind and the wallet of the customer. Peter Thiel says – Competition is for losers. If you want to create and capture lasting value, look to build a monopoly.” Once that is built, it would be hard to displace!
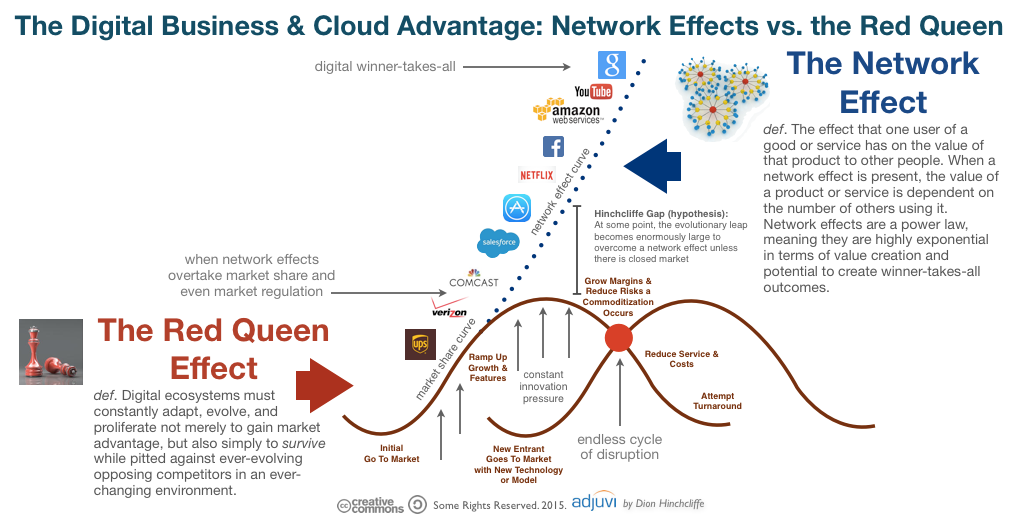
Scaling the organization intentionally is key to long-term success. There are a number of factors that contribute toward developing scale and thus establishing a strong footing in the particular markets. We are listing some of the key factors below:
- Barriers to entry: Some organizations have natural cost prohibitive barriers to entry like utility companies or automobile plants. They require large investments. On the other hand, organizations can themselves influence and erect huge barriers to entry even though the barriers did not exist. Organizations would massively invest in infrastructure, distribution, customer acquisition and retention, brand and public relations. Organizations that are able to rapidly do this at a massive scale would be the ones that is expected to exercise their leverage over a big consumption base well into the future.
- Multi-sided platform impacts: The value of information across multiple subsystems: company, supplier, customer, government increases disproportionately as it expands. We had earlier noted that if cities expand by 100%, then there is increasing innovating and goods that generate 115% -the concept of super-linear scaling. As more nodes are introduced into the system and a better infrastructure is created to support communication and exchange between the nodes, the more entrenched the business becomes. And interestingly, the business grows at a sub-linear scale – namely, it consumes less and less resources in proportion to its growth. Hence, we see the large unicorn valuation among companies where investors and market makers place calculated bets on investments of colossal magnitudes. The magnitude of such investments is relatively a recent event, and this is largely driven by the advances in technology that connect all stakeholders.
- Investment in learning: To manage scale is to also be selective of information that a system receives and how the information is processed internally. In addition, how is this information relayed to the external system or environment. This requires massive investment in areas like machine learning, artificial intelligence, big data, enabling increased computational power, development of new learning algorithms, etc. This means that organizations have to align infrastructure and capability while also working with external environments through public relations, lobbying groups and policymakers to chaperone a comprehensive and a very complex hard-to-replicate learning organism.
- Investment in brand: Brand personifies the value attributes of an organization. One connects brand to customer experience and perception of the organization’s product. To manage scale and grow, organizations must invest in brand: to capture increased mindshare of the consumer. In complexity science terms, the internal systems are shaped to emit powerful signals to the external environment and urge a response. Brand and learning work together to allow a harmonic growth of an internal system in the context of its immediate environment.
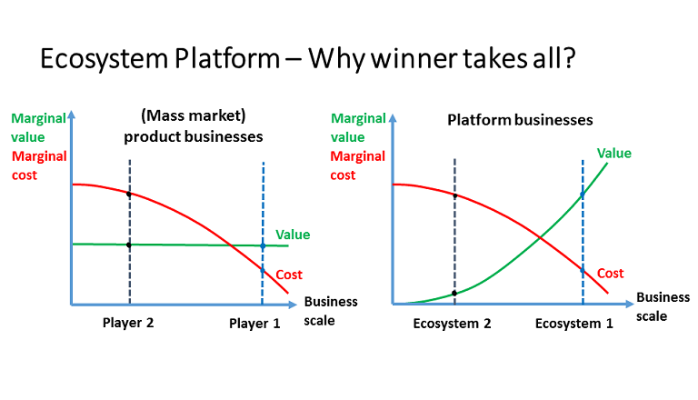
However, one must revert to the science of complexity to understand the long-term challenges of a winner-take-all mechanism. We have already seen the example that what is good for the individual bull-elk might not be the best for the species in the long-term. We see that super-linear scaling systems also emits significant negative by-products. Thus, the question that we need to ask is whether the organizations are paradoxically cultivating their own seeds of destruction in their ambitions of pursuing scale and market entrenchment.
Scaling Considerations in Complex Systems and Organizations: Implications
Scale represents size. In a two-dimensional world, it is a linear measurement that presents a nominal ordering of numbers. In other words, 4 is two times two and 6 would be 3 times two. In other words, the difference between 4 and 6 represents an increase in scale by two. We will discuss various aspects of scale and the learnings that we can draw from it. However, before we go down this path, we would like to touch on resource consumption.

As living organisms, we consume resources. An average human being requires 2000 calories of food per day to sustain themselves. An average human being, by the way, is largely defined in terms of size. So it would be better put if we say that a 200lb person would require 2000 calories. However, if we were to regard a specimen that is 10X the size or 2000 lbs., would it require 10X the calories to sustain itself? Conversely, if the specimen was 1/100th the size of the average human being, then would it require 1/100th the calories to sustain itself. Thus, will we consume resources linearly to our size? Are we operating in a simple linear world? And if not, what are the ramifications for science, physics, biology, organizations, cities, climate, etc.?
Let us digress a little bit from the above questions and lay out a few interesting facts. Almost half of the population in the world today live in cities. This is compared to less than 15% of the world population that lived in cities a hundred years ago. It is anticipated that almost 75% of the world population will be living in cities by 2050. The number of cities will increase and so will the size. But for cities to increase in size and numbers, it requires vast amount of resources. In fact, the resource requirements in cities are far more extensive than in agrarian societies. If there is a limit to the resources from a natural standpoint – in other words, if the world is operating on a budget of natural resources – then would this mean that the growth of the cities will be naturally reined in? Will cities collapse because of lack of resources to support its mass?
What about companies? Can companies grow infinitely? Is there a natural point where companies might hit their limit beyond which growth would not be possible? Could a company collapse because the amount of resources that is required to sustain the size would be compromised? Are there other factors aside from resource consumption that play into what might cap the growth and hence the size of the company? Are there overriding factors that come into play that would superimpose the size-resource usage equation such that our worries could be safely kept aside? Are cities and companies governed by some sort of metabolic rate that governs the sustenance of life?

Geoffrey West, a theoretical physicist, has touched on a lot of the questions in his book: Scale: The Universal Laws of Growth, Innovation, Sustainability, and the Pace of Life in Organisms, Cities, Economies, and Companies. He says that a person requires about 90W (watts) of energy to survive. That is a light bulb burning in your living room in one day. That is our metabolic rate. However, just like man does not live by bread alone, an average man has to depend on a number of other artifacts that have agglomerated in bits and pieces to provide a quality of life to maximize sustenance. The person has to have laws, electricity, fuel, automobile, plumbing and water, markets, banks, clothes, phones and engage with other folks in a complex social network to collaborate and compete to achieve their goals. Geoffrey West says that the average person requires almost 11000W or the equivalent of almost 125 90W light bulbs. To put things in greater perspective, the social metabolic rate of 11,000W is almost equivalent to a dozen elephants. (An elephant requires 10X more energy than humans even though they might be 60X the size of the physical human being). Thus, a major portion of our energy is diverted to maintain the social and physical network that closely interplay to maintain our sustenance. And while we consume massive amounts of energy, we also create a massive amount of waste – and that is an inevitable outcome. This is called the entropy impact and we will touch on this in greater detail in later articles. Hence, our growth is not only constrained by our metabolic rate: it is further dampened by entropy that exists as the Second Law of Thermodynamics. And as a system ages, the impact of entropy increases manifold. Yes, it is true: once we get old, we are racing toward our death at a faster pace than when we were young. Our bodies are exhibiting fatigue faster than normal.
Scaling refers to how a system responds when its size changes. As mentioned earlier, does scaling follow a linear model? Do we need to consume 2X resources if we increase the size by 2X? How does scaling impact a Complex Physical System versus a Complex Adaptive System? Will a 2X impact on the initial state create perturbations in a CPS model which is equivalent to 2X? How would this work on a CAS model where the complexity is far from defined and understood because these systems are continuously evolving? Does half as big requires half as much or conversely twice as big requires twice as much? Once again, I have liberally dipped into this fantastic work by Geoffrey West to summarize, as best as possible, the definitions and implications. He proves that we cannot linearly extrapolate energy consumption and size: the world is smattered with evidence that undermines the linear extrapolation model. In fact, as you grow, you become more efficient with respect to energy consumption. The savings of energy due to growth in size is commonly called the economy of scale. His research also suggests two interesting results. When cities or social systems grow, they require an infrastructure to help with the growth. He discovered that it takes 85% resource consumption to grow the systems by 100%. Thus, there is a savings of 15% which is slightly lower than what has been studied on the biological front wherein organisms save 25% as they grow. He calls this sub linear scaling. In contrast, he also introduces the concept of super linear scaling wherein there is a 15% increasing returns to scale when the city or a social system grows. In other words, if the system grows by 100%, the positive returns with respect to such elements like patents, innovation, etc. will grow by 115%. In addition, the negative elements also grow in an equivalent manner – crime, disease, social unrest, etc. Thus, the growth in cities are supported by an efficient infrastructure that generates increasing returns of good and bad elements.
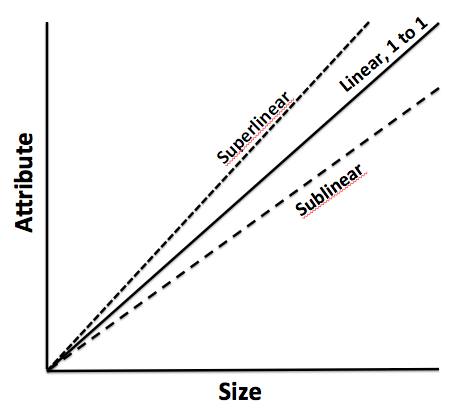
Max Kleiber, a Swiss chemist, in the 1930’s proposed the Kleiber’s law which sheds a lot of light on metabolic rates as energy consumption per unit of time. As mass increases so does the overall metabolic rate but it is not a linear relation – it obeys the power law. It stays that a living organism’s metabolic rate scales to the ¾ power of its mass. If the cat has a mass 100 times that of a mouse, the cat will metabolize about 100 ¾ = 31.63 times more energy per day rather than 100 times more energy per day. Kleiber’s law has led to the metabolic theory of energy and posits that the metabolic rate of organisms is the fundamental biological rate that governs most observed patters in our immediate ecology. There is some ongoing debate on the mechanism that allows metabolic rate to differ based on size. One mechanism is that smaller organisms have higher surface area to volume and thus needs relatively higher energy versus large organisms that have lower surface area to volume. This assumes that energy consumption occurs across surface areas. However, there is another mechanism that argues that energy consumption happens when energy needs are distributed through a transport network that delivers and synthesizes energy. Thus, smaller organisms do not have as a rich a network as large organisms and thus there is greater energy efficiency usage among smaller organisms than larger organisms. Either way, the implications are that body size and temperature (which is a result of internal activity) provide fundamental and natural constraints by which our ecological processes are governed. This leads to another concept called finite time singularity which predicts that unbounded growth cannot be sustained because it would need infinite resources or some K factor that would allow it to increase. The K factor could be innovation, a structural shift in how humans and objects cooperate, or even a matter of jumping on a spaceship and relocating to Mars.
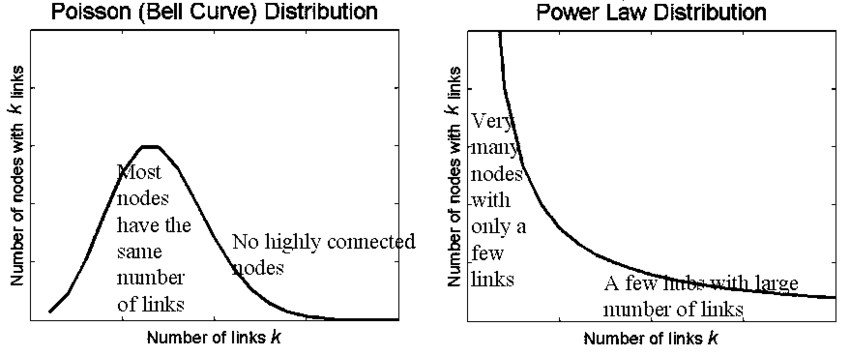
We are getting bigger faster. That is real. The specter of a dystopian future hangs upon us like the sword of Damocles. The thinking is that this rate of growth and scale is not sustainable since it is impossible to marshal the resources to feed the beast in an adequate and timely manner. But interestingly, if we were to dig deeper into history – these thoughts prevailed in earlier times as well but perhaps at different scale. In 1798 Thomas Robert Malthus famously predicted that short-term gains in living standards would inevitably be undermined as human population growth outstripped food production, and thereby drive living standards back toward subsistence. Humanity thus was checkmated into an inevitable conclusion: a veritable collapse spurred by the tendency of population to grow geometrically while food production would increase only arithmetically. Almost two hundred years later, a group of scientists contributed to the 1972 book called Limits to Growth which had similar refrains like Malthus: the population is growing and there are not enough resources to support the growth and that would lead to the collapse of our civilization. However, humanity has negotiated those dark thoughts and we continue to prosper. If indeed, we are governed by this finite time singularity, we are aware that human ingenuity has largely won the day. Technology advancements, policy and institutional changes, new ways of collaboration, etc. have emerged to further delay this “inevitable collapse” that could be result of more mouths to feed than possible. What is true is that the need for new innovative models and new ways of doing things to solve the global challenges wrought by increased population and their correspondent demands will continue to increase at a quicker pace. Once could thus argue that the increased pace of life would not be sustainable. However, that is not a plausible hypothesis based on our assessment of where we are and where we have been.
Let us turn our attention to a business. We want the business to grow or do we want the business to scale? What is the difference? To grow means that your company is adding resources or infrastructure to handle increased demand, at a cost which is equivalent to the level of increased revenue coming in. Scaling occurs when the business is growing faster than the resources that are being consumed. We have already explored that outlier when you grow so big that you are crushed by your weight. It is that fact which limits the growth of organism regardless of issues related to scale. Similarly, one could conceivably argue that there are limits to growth of a company and might even turn to history and show that a lot of large companies of yesteryears have collapsed. However, it is also safe to say that large organizations today are by several factors larger than the largest organizations in the past, and that is largely on account of accumulated knowledge and new forms of innovation and collaboration that have allowed that to happen. In other words, the future bodes well for even larger organizations and if those organizations indeed reach those gargantuan size, it is also safe to draw the conclusion that they will be consuming far less resources relative to current organizations, thus saving more energy and distributing more wealth to the consumers.
Thus, scaling laws limit growth when it assumes that everything else is constant. However, if there is innovation that leads to structural changes of a system, then the limits to growth becomes variable. So how do we effect structural changes? What is the basis? What is the starting point? We look at modeling as a means to arrive at new structures that might allow the systems to be shaped in a manner such that the growth in the systems are not limited by its own constraints of size and motion and temperature (in physics parlance). Thus, a system is modeled at a presumably small scale but with the understanding that as the system is increases in size, the inner workings of emergent complexity could be a problem. Hence, it would be prudent to not linearly extrapolate the model of a small system to that of a large one but rather to exponential extrapolate the complexity of the new system that would emerge. We will discuss this in later articles, but it would be wise to keep this as a mental note as we forge ahead and refine our understanding of scale and its practical implications for our daily consumption.
Model Thinking
| Model Framework |
The fundamental tenet of theory is the concept of “empiria“. Empiria refers to our observations. Based on observations, scientists and researchers posit a theory – it is part of scientific realism.
A scientific model is a causal explanation of how variables interact to produce a phenomenon, usually linearly organized. A model is a simplified map consisting of a few, primary variables that is gauged to have the most explanatory powers for the phenomenon being observed. We discussed Complex Physical Systems and Complex Adaptive Systems early on this chapter. It is relatively easier to map CPS to models than CAS, largely because models become very unwieldy as it starts to internalize more variables and if those variables have volumes of interaction between them. A simple analogy would be the use of multiple regression models: when you have a number of independent variables that interact strongly between each other, autocorrelation errors occur, and the model is not stable or does not have predictive value.

Research projects generally tend to either look at a case study or alternatively, they might describe a number of similar cases that are logically grouped together. Constructing a simple model that can be general and applied to many instances is difficult, if not impossible. Variables are subject to a researcher’s lack of understanding of the variable or the volatility of the variable. What further accentuates the problem is that the researcher misses on the interaction of how the variables play against one another and the resultant impact on the system. Thus, our understanding of our system can be done through some sort of model mechanics but, yet we share the common belief that the task of building out a model to provide all of the explanatory answers are difficult, if not impossible. Despite our understanding of our limitations of modeling, we still develop frameworks and artifact models because we sense in it a tool or set of indispensable tools to transmit the results of research to practical use cases. We boldly generalize our findings from empiria into general models that we hope will explain empiria best. And let us be mindful that it is possible – more so in the CAS systems than CPS that we might have multiple models that would fight over their explanatory powers simply because of the vagaries of uncertainty and stochastic variations.
Popper says: “Science does not rest upon rock-bottom. The bold structure of its theories rises, as it were, above a swamp. It is like a building erected on piles. The piles are driven down from above into the swamp, but not down to any natural or ‘given’ base; and when we cease our attempts to drive our piles into a deeper layer, it is not because we have reached firm ground. We simply stop when we are satisfied that they are firm enough to carry the structure, at least for the time being”. This leads to the satisficing solution: if a model can choose the least number of variables to explain the greatest amount of variations, the model is relatively better than other models that would select more variables to explain the same. In addition, there is always a cost-benefit analysis to be taken into consideration: if we add x number of variables to explain variation in the outcome but it is not meaningfully different than variables less than x, then one would want to fall back on the less-variable model because it is less costly to maintain.
Researchers must address three key elements in the model: time, variation and uncertainty. How do we craft a model which reflects the impact of time on the variables and the outcome? How to present variations in the model? Different variables might vary differently independent of one another. How do we present the deviation of the data in a parlance that allows us to make meaningful conclusions regarding the impact of the variations on the outcome? Finally, does the data that is being considered are actual or proxy data? Are the observations approximate? How do we thus draw the model to incorporate the fuzziness: would confidence intervals on the findings be good enough?
Two other equally other concepts in model design is important: Descriptive Modeling and Normative Modeling.
Descriptive models aim to explain the phenomenon. It is bounded by that goal and that goal only.
There are certain types of explanations that they fall back on: explain by looking at data from the past and attempting to draw a cause and effect relationship. If the researcher is able to draw a complete cause and effect relationship that meets the test of time and independent tests to replicate the results, then the causality turns into law for the limited use-case or the phenomenon being explained. Another explanation method is to draw upon context: explaining a phenomenon by looking at the function that the activity fulfills in its context. For example, a dog barks at a stranger to secure its territory and protect the home. The third and more interesting type of explanation is generally called intentional explanation: the variables work together to serve a specific purpose and the researcher determines that purpose and thus, reverse engineers the understanding of the phenomenon by understanding the purpose and how the variables conform to achieve that purpose.
This last element also leads us to thinking through the other method of modeling – namely, normative modeling. Normative modeling differs from descriptive modeling because the target is not to simply just gather facts to explain a phenomenon, but rather to figure out how to improve or change the phenomenon toward a desirable state. The challenge, as you might have already perceived, is that the subjective shadow looms high and long and the ultimate finding in what would be a normative model could essentially be a teleological representation or self-fulfilling prophecy of the researcher in action. While this is relatively more welcome in a descriptive world since subjectivism is diffused among a larger group that yields one solution, it is not the best in a normative world since variation of opinions that reflect biases can pose a problem.
How do we create a representative model of a phenomenon? First, we weigh if the phenomenon is to be understood as a mere explanation or to extend it to incorporate our normative spin on the phenomenon itself. It is often the case that we might have to craft different models and then weigh one against the other that best represents how the model can be explained. Some of the methods are fairly simple as in bringing diverse opinions to a table and then agreeing upon one specific model. The advantage of such an approach is that it provides a degree of objectivism in the model – at least in so far as it removes the divergent subjectivity that weaves into the various models. Other alternative is to do value analysis which is a mathematical method where the selection of the model is carried out in stages. You define the criteria of the selection and then the importance of the goal (if that be a normative model). Once all of the participants have a general agreement, then you have the makings of a model. The final method is to incorporate all all of the outliers and the data points in the phenomenon that the model seeks to explain and then offer a shared belief into those salient features in the model that would be best to apply to gain information of the phenomenon in a predictable manner.
There are various languages that are used for modeling:
Written Language refers to the natural language description of the model. If price of butter goes up, the quantity demanded of the butter will go down. Written language models can be used effectively to inform all of the other types of models that follow below. It often goes by the name of “qualitative” research, although we find that a bit limiting. Just a simple statement like – This model approximately reflects the behavior of people living in a dense environment …” could qualify as a written language model that seeks to shed light on the object being studied.
Icon Models refer to a pictorial representation and probably the earliest form of model making. It seeks to only qualify those contours or shapes or colors that are most interesting and relevant to the object being studied. The idea of icon models is to pictorially abstract the main elements to provide a working understanding of the object being studied.
Topological Models refer to how the variables are placed with respect to one another and thus helps in creating a classification or taxonomy of the model. Once can have logical trees, class trees, Venn diagrams, and other imaginative pictorial representation of fields to further shed light on the object being studied. In fact, pictorial representations must abide by constant scale, direction and placements. In other words, if the variables are placed on a different scale on different maps, it would be hard to draw logical conclusions by sight alone. In addition, if the placements are at different axis in different maps or have different vectors, it is hard to make comparisons and arrive at a shared consensus and a logical end result.
Arithmetic Models are what we generally fall back on most. The data is measured with an arithmetic scale. It is done via tables, equations or flow diagrams. The nice thing about arithmetic models is that you can show multiple dimensions which is not possible with other modeling languages. Hence, the robustness and the general applicability of such models are huge and thus is widely used as a key language to modeling.
Analogous Models refer to crafting explanations using the power of analogy. For example, when we talk about waves – we could be talking of light waves, radio waves, historical waves, etc. These metaphoric representations can be used to explain phenomenon, but at best, the explanatory power is nebulous, and it would be difficult to explain the variations and uncertainties between two analogous models. However, it still is used to transmit information quickly through verbal expressions like – “Similarly”, “Equivalently”, “Looks like ..” etc. In fact, extrapolation is a widely used method in modeling and we would ascertain this as part of the analogous model to a great extent. That is because we time-box the variables in the analogous model to one instance and the extrapolated model to another instance and we tie them up with mathematical equations.
