Blog Archives

The Finance Playbook for Scaling Complexity Without Chaos
From Controlled Growth to Operational Grace
Somewhere between Series A optimism and Series D pressure sits the very real challenge of scale. Not just growth for its own sake but growth with control, precision, and purpose. A well-run finance function becomes less about keeping the lights on and more about lighting the runway. I have seen it repeatedly. You can double ARR, but if your deal desk, revenue operations, or quote-to-cash processes are even slightly out of step, you are scaling chaos, not a company.
Finance does not scale with spreadsheets and heroics. It scales with clarity. With every dollar, every headcount, and every workflow needing to be justified in terms of scale, simplicity must be the goal. I recall sitting in a boardroom where the CEO proudly announced a doubling of the top line. But it came at the cost of three overlapping CPQ systems, elongated sales cycles, rogue discounting, and a pipeline no one trusted. We did not have a scale problem. We had a complexity problem disguised as growth.
OKRs Are Not Just for Product Teams
When finance is integrated into company OKRs, magic happens. We begin aligning incentives across sales, legal, product, and customer success teams. Suddenly, the sales operations team is not just counting bookings but shaping them. Deal desk isn’t just a speed bump before legal review, but a value architect. Our quote-to-cash process is no longer a ticketing system but a flywheel for margin expansion.
At a Series B company, their shift began by tying financial metrics directly to the revenue team’s OKRs. Quota retirement was not enough. They measured the booked gross margin. Customer acquisition cost. Implementation of velocity. The sales team was initially skeptical but soon began asking more insightful questions. Deals that initially appeared promising were flagged early. Others that seemed too complicated were simplified before they even reached RevOps. Revenue is often seen as art. But finance gives it rhythm.

Scaling Complexity Despite the Chaos
The truth is that chaos is not the enemy of scale. Chaos is the cost of momentum. Every startup that is truly growing at a pace inevitably creates complexity. Systems become tangled. Roles blur. Approvals drift. That is not failure. That is physics. What separates successful companies is not the absence of chaos but their ability to organize it.
I often compare this to managing a growing city. You do not stop new buildings from going up just because traffic worsens. You introduce traffic lights, zoning laws, and transit systems that support the growth. In finance, that means being ready to evolve processes as soon as growth introduces friction. It means designing modular systems where complexity is absorbed rather than resisted. You do not simplify the growth. You streamline the experience of growing. Read Scale by Geoffrey West. Much of my interest in complexity theory and architecture for scale comes from it. Also, look out for my book, which will be published in February 2026: Complexity and Scale: Managing Order from Chaos. This book aligns literature in complexity theory with the microeconomics of scaling vectors and enterprise architecture.
At a late-stage Series C company, the sales motion had shifted from land-and-expand to enterprise deals with multi-year terms and custom payment structures. The CPQ tool was unable to keep up. Rather than immediately overhauling the tool, they developed middleware logic that routed high-complexity deals through a streamlined approval process, while allowing low-risk deals to proceed unimpeded. The system scaled without slowing. Complexity still existed, but it no longer dictated pace.
Cash Discipline: The Ultimate Growth KPI
Cash is not just oxygen. It is alignment. When finance speaks early and often about burn efficiency, marginal unit economics, and working capital velocity, we move from gatekeepers to enablers. I often remind founders that the cost of sales is not just the commission plan. It’s in the way deals are structured. It’s in how fast a contract can be approved. It’s in how many hands a quote needs to pass through.
At one Series A professional services firm, they introduced a “Deal ROI Calculator” at the deal desk. It calculated not just price and term but implementation effort, support burden, and payback period. The result was staggering. Win rates remained stable, but average deal profitability increased by 17 percent. Sales teams began choosing deals differently. Finance was not saying no. It was saying, “Say yes, but smarter.”
Velocity is a Decision, Not a Circumstance
The best-run companies are not faster because they have fewer meetings. They are faster because decisions are closer to the data. Finance’s job is to put insight into the hands of those making the call. The goal is not to make perfect decisions. It is to make the best decision possible with the available data and revisit it quickly.
In one post-Series A firm, we embedded finance analysts inside revenue operations. It blurred the traditional lines but sped up decision-making. Discount approvals have been reduced from 48 hours to 12-24 hours. Pricing strategies became iterative. A finance analyst co-piloted the forecast and flagged gaps weeks earlier than our CRM did. It wasn’t about more control. It was about more confidence.
When Process Feels Like Progress
It is tempting to think that structure slows things down. However, the right QTC design can unlock margin, trust, and speed simultaneously. Imagine a deal desk that empowers sales to configure deals within prudent guardrails. Or a contract management workflow that automatically flags legal risks. These are not dreams. These are the functions we have implemented.
The companies that scale well are not perfect. But their finance teams understand that complexity compounds quietly. And so, we design our systems not to prevent chaos but to make good decisions routine. We don’t wait for the fire drill. We design out the fire.
Make Your Revenue Operations Your Secret Weapon
If your finance team still views sales operations as a reporting function, you are underutilizing a strategic lever. Revenue operations, when empowered, can close the gap between bookings and billings. They can forecast with precision. They can flag incentive misalignment. One of the best RevOps leaders I worked with used to say, “I don’t run reports. I run clarity.” That clarity was worth more than any point solution we bought.
In scaling environments, automation is not optional. But automation alone does not save a broken process. Finance must own the blueprint. Every system, from CRM to CPQ to ERP, must speak the same language. Data fragmentation is not just annoying. It is value-destructive.
What Should You Do Now?
Ask yourself: Does finance have visibility into every step of the revenue funnel? Do our QTC processes support strategic flexibility? Is our deal desk a source of friction or a source of enablement? Can our sales comp plan be audited and justified in a board meeting without flinching?
These are not theoretical. They are the difference between Series C confusion and Series D confidence.
Let’s Make This Personal
I have seen incredible operators get buried under process debt because they mistook motion for progress. I have seen lean finance teams punch above their weight because they anchored their operating model in OKRs, cash efficiency, and rapid decision cycles. I have also seen the opposite. A sales ops function sitting in the corner. A deal desk no one trusts. A QTC process where no one knows who owns what.
These are fixable. But only if finance decides to lead. Not just report.
So here is my invitation. If you are a CFO, a CRO, a GC, or a CEO reading this, take one day this quarter to walk your revenue path from lead to cash. Sit with the people who feel the friction. Map the handoffs. And then ask, is this how we scale with control? Do you have the right processes in place? Do you have the technology to activate the process and minimize the friction?

Beyond the Buzz: The Real Economics Behind SaaS, AI, and Everything in Between
Introduction
Throughout my career, I have had the privilege of working in and leading finance teams across several SaaS companies. The SaaS model is familiar territory to me: its economics are well understood, its metrics are measurable, and its value creation pathways have been tested over time. Erich Mersch’s book on SaaS Hacks is my Bible. In contrast, my exposure to pure AI companies has been more limited. I have directly supported two AI-driven businesses, and much of my perspective comes from observation, benchmarking, and research. This combination of direct experience and external study has hopefully shaped a balanced view: one grounded in practicality yet open to the new dynamics emerging in the AI era.
Across both models, one principle remains constant: a business is only as strong as its unit economics. When leaders understand the economics of their business, they gain the ability to map them to daily operations, and from there, to the financial model. The linkage from unit economics to operations to financial statements is what turns financial insight into strategic control. It ensures that decisions on pricing, product design, and investment are all anchored in how value is truly created and captured.
Today, CFOs and CEOs must not only manage their profit and loss (P&L) statement but also understand the anatomy of revenue, cost, and cash flow at the micro level. SaaS, AI, and hybrid SaaS-AI models each have unique economic signatures. SaaS rewards scalability and predictability. AI introduces variability and infrastructure intensity. Hybrids offer both opportunity and complexity. This article examines the financial structure, gross margin profile, and investor lens of each model to help finance leaders not only measure performance but also interpret it by turning data into judgment and judgment into a better strategy.
Part I: SaaS Companies — Economics, Margins, and Investor Lens
The heart of any SaaS business is its recurring revenue model. Unlike traditional software, where revenue is recognized upfront, SaaS companies earn revenue over time as customers subscribe to a service. This shift from ownership to access creates predictable revenue streams but also introduces delayed payback cycles and continuous obligations to deliver value. Understanding the unit economics behind this model is essential for CFOs and CEOs, as it enables them to see beyond top-line growth and assess whether each customer, contract, or cohort truly creates long-term value.
A strong SaaS company operates like a flywheel. Customer acquisition drives recurring revenue, which funds continued innovation and improved service, in turn driving more customer retention and referrals. But a flywheel is only as strong as its components. The economics of SaaS can be boiled down to a handful of measurable levers: gross margin, customer acquisition cost, retention rate, lifetime value, and cash efficiency. Each one tells a story about how the company converts growth into profit.
The SaaS Revenue Engine
At its simplest, a SaaS company makes money by providing access to its platform on a subscription basis. The standard measure of health is Annual Recurring Revenue (ARR). ARR represents the contracted annualized value of active subscriptions. It is the lifeblood metric of the business. When ARR grows steadily with low churn, the company can project future cash flows with confidence.
Revenue recognition in SaaS is governed by time. Even if a customer pays upfront, the revenue is recognized over the duration of the contract. This creates timing differences between bookings, billings, and revenue. CFOs must track all three to understand both liquidity and profitability. Bookings signal demand, billings signal cash inflow, and revenue reflects the value earned.
One of the most significant advantages of SaaS is predictability. High renewal rates lead to stable revenues. Upsells and cross-sells increase customer lifetime value. However, predictability can also mask underlying inefficiencies. A SaaS business can grow fast and still destroy value if each new customer costs more to acquire than they bring in lifetime revenue. This is where unit economics comes into play.
Core Unit Metrics in SaaS
The three central metrics every CFO and CEO must know are:
- Customer Acquisition Cost (CAC): The total sales and marketing expenses needed to acquire one new customer.
- Lifetime Value (LTV): The total revenue a customer is expected to generate over their relationship with the company.
- Payback Period: The time it takes for gross profit from a customer to recover CAC.
A healthy SaaS business typically maintains an LTV-to-CAC ratio of at least 3:1. This means that for every dollar spent acquiring a customer, the company earns three dollars in lifetime value. Payback periods under twelve months are typically considered strong, especially in mid-market or enterprise SaaS. Long payback periods signal cash inefficiency and high-risk during downturns.
Retention is equally essential. The stickier the product, the lower the churn, and the more predictable the revenue. Net revenue retention (NRR) is a powerful metric because it combines churn and expansion. A business with 120 percent NRR is growing revenue even without adding new customers, which investors love to see.
Gross Margin Dynamics
Gross margin is the backbone of SaaS profitability. It measures how much of each revenue dollar remains after deducting direct costs, such as hosting, support, and third-party software fees. Well-run SaaS companies typically achieve gross margins of between 75% and 85%. This reflects the fact that software is highly scalable. Once built, it can be replicated at almost no additional cost. They use the margins to fund their GTM strategy. They have room until they don’t.
However, gross margin is not guaranteed. In practice, it can erode for several reasons. First, rising cloud infrastructure costs can quietly eat into margins if not carefully managed. Companies that rely heavily on AWS, Azure, or Google Cloud need cost optimization strategies, including reserved instances and workload tuning. Second, customer support and success functions, while essential, can become heavy if processes are not automated. Third, complex integrations or data-heavy products can increase variable costs per customer.
Freemium and low-entry pricing models can also dilute margins if too many users remain on free tiers or lower-paying plans. The CFO’s job is to ensure that pricing reflects the actual value delivered and that the cost-to-serve remains aligned with revenue per user. A mature SaaS company tracks unit margins by customer segment to identify where profitability thrives or erodes.
Operating Leverage and the Rule of 40
The power of SaaS lies in its potential for operating leverage. Fixed costs, such as R&D, engineering, and sales infrastructure, remain relatively constant as revenue scales. As a result, incremental revenue flows disproportionately to the bottom line once the business passes break-even. This makes SaaS an attractive model once scale is achieved, although reaching that scale can take a considerable amount of time.
The Rule of 40 is a shorthand metric many investors use to gauge the balance between growth and profitability. It states that a SaaS company’s revenue growth rate, plus its EBITDA margin, should equal or exceed 40 percent. A company growing 30 percent annually with a 15 percent EBITDA margin scores 45, which is considered healthy. A company growing at 60 percent but losing 30 percent EBITDA would score 30, suggesting inefficiency. This rule forces management to strike a balance between ambition and discipline. This 40% rule was based on empirical analysis, and every Jack and Jill swears by it. I am not sure that we can have this Rule and apply it blindly. I am not generally in favor of these broad rules. That is a lot of fodder for a different conversation.
Cash Flow and Efficiency
Cash flow timing is another defining feature of SaaS. Many customers prepay annually, creating favorable working capital dynamics. This gives SaaS companies negative net working capital, which can help fund growth. However, high upfront CAC and long payback periods can strain cash reserves. CFOs must ensure growth is financed efficiently and that burn multiples remain sustainable. Burn-multiple measures the cash burn relative to net new ARR added. A burn rate of multiple below 1 is excellent; it means the company spends one dollar to generate one dollar of recurring revenue. Ratios above 2 suggest inefficiency.
As markets have tightened, investors have shifted focus from pure growth to efficient growth. Cash is no longer cheap, and dilution from equity raises is costly. I attended a networking event in San Jose about a month ago, and one of the finance leaders said, “We are in the middle of a nuclear winter.” I thought that summarized the current state of the funding market. Therefore, SaaS CFOs must guide companies toward self-funding growth, improving gross margins, and shortening CAC payback cycles.
Valuation and Investor Perspective
Investors view SaaS companies through the lens of predictability, scalability, and margin potential. Historically, during low-interest-rate periods, high-growth SaaS companies traded at 10 to 15 times ARR. In the current normalized environment, top performers trade between 5 and 8 times ARR, with discounts for slower growth or lower margins.
The key drivers of valuation include:
- Growth Rate: Faster ARR growth leads to higher multiples, provided it is efficient.
- Gross Margin: High margins indicate scalability and control over cost structure.
- Retention and Expansion: Strong NRR signals durable revenue and pricing power.
- Profitability Trajectory: Investors reward companies that balance growth with clear paths to cash flow breakeven.
Investors now differentiate between the quality of growth and the quantity of growth. Revenue driven by deep discounts or heavy incentives is less valuable than revenue driven by customer adoption and satisfaction. CFOs must clearly communicate cohort performance, renewal trends, and contribution margins to demonstrate that growth is sustainable and durable.
Emerging Challenges in SaaS Economics
While SaaS remains a powerful model, new challenges have emerged. Cloud infrastructure costs are rising, putting pressure on gross margins. AI features are becoming table stakes, but they introduce new variable costs tied to compute. Customer expectations are also shifting toward usage-based pricing, which can lead to reduced predictability in revenue recognition.
To navigate these shifts, CFOs must evolve their financial reporting and pricing strategies. Gross margin analysis must now include compute efficiency metrics. Sales compensation plans must reflect profitability, not just bookings. Pricing teams must test elasticity to ensure ARPU growth outpaces cost increases.
SaaS CFOs must also deepen their understanding of cohort economics. Not all customers are equal. Some segments deliver faster payback and higher retention, while others create drag. Segmented reporting enables management to allocate capital wisely and avoid pursuing unprofitable markets.
The Path Forward
The essence of SaaS unit economics is discipline. Growth only creates value when each unit of growth strengthens the financial foundation. This requires continuous monitoring of margins, CAC, retention, and payback. It also requires cross-functional collaboration between finance, product, and operations. Finance must not only report outcomes but also shape strategy, ensuring that pricing aligns with value and product decisions reflect cost realities.
For CEOs, understanding these dynamics is vital to setting priorities. For CFOs, the task is to build a transparent model that links operational levers to financial outcomes. Investors reward companies that can tell a clear story with data: a path from top-line growth to sustainable free cash flow.
Ultimately, SaaS remains one of the most attractive business models when executed effectively. The combination of recurring revenue, high margins, and operating leverage creates long-term compounding value. But it rewards precision. The CFO who masters unit economics can turn growth into wealth, while the one who ignores it may find that scale without discipline is simply a faster road to inefficiency. The king is not dead: Long live the king.
Part II: Pure AI Companies — Economics, Margins, and Investor Lens
Artificial intelligence companies represent a fundamentally different business model from traditional SaaS. Where SaaS companies monetize access to pre-built software, AI companies monetize intelligence: the ability of models to learn, predict, and generate. This shift changes everything about unit economics. The cost per unit of value is no longer near zero. It is tied to the underlying cost of computation, data processing, and model maintenance. As a result, CFOs and CEOs leading AI-first companies must rethink what scale, margin, and profitability truly mean.
While SaaS scales easily once software is built, AI scales conditionally. Each customer interaction may trigger new inference requests, consume GPU time, and incur variable costs. Every additional unit of demand brings incremental expenses. The CFO’s challenge is to translate these technical realities into financial discipline, which involves building an organization that can sustain growth without being constrained by its own cost structure.
Understanding the AI Business Model
AI-native companies generate revenue by providing intelligence as a service. Their offerings typically fall into three categories:
- Platform APIs: Selling access to models that perform tasks such as image recognition, text generation, or speech processing.
- Enterprise Solutions: Custom model deployments tailored for specific industries like healthcare, finance, or retail.
- Consumer Applications: AI-powered tools like copilots, assistants, or creative generators.
Each model has unique economics. API-based businesses often employ usage-based pricing, resembling utilities. Enterprise AI firms resemble consulting hybrids, blending software with services. Consumer AI apps focus on scale, requiring low-cost inference to remain profitable.
Unlike SaaS subscriptions, AI revenue is often usage-driven. This makes it more elastic but less predictable. When customers consume more tokens, queries, or inferences, revenue rises but so do costs. This tight coupling between revenue and cost means margins depend heavily on technical efficiency. CFOs must treat cost-per-inference as a central KPI, just as SaaS leaders track gross margin percentage.
Gross Margins and Cost Structures
For pure AI companies, the gross margin reflects the efficiency of their infrastructure. In the early stages, margins often range between 40% and 60%. With optimization, some mature players approach 70 percent or higher. However, achieving SaaS-like margins requires significant investment in optimization techniques, such as model compression, caching, and hardware acceleration.
The key cost components include:
- Compute: GPU and cloud infrastructure costs are the most significant variable expenses. Each inference consumes compute cycles, and large models require expensive hardware.
- Data: Training and fine-tuning models involve significant data acquisition, labeling, and storage costs.
- Serving Infrastructure: Orchestration, latency management, and load balancing add further expenses.
- Personnel: Machine learning engineers, data scientists, and research teams represent high fixed costs.
Unlike SaaS, where the marginal cost per user declines toward zero, AI marginal costs can remain flat or even rise with increasing complexity. The more sophisticated the model, the more expensive it is to serve each request. CFOs must therefore design pricing strategies that match the cost-to-serve, ensuring unit economics remain positive.
To track progress, leading AI finance teams adopt new metrics such as cost per 1,000 tokens, cost per inference, or cost per output. These become the foundation for gross margin improvement programs. Without these metrics, management cannot distinguish between profitable and loss-making usage.
Capital Intensity and Model Training
A defining feature of AI economics is capital intensity. Training large models can cost tens or even hundreds of millions of dollars. These are not operating expenses in the traditional sense; they are long-term investments. The question for CFOs is how to treat them. Should they be expensed, like research and development, or capitalized, like long-lived assets? The answer depends on accounting standards and the potential for model reuse.
If a model will serve as a foundation for multiple products or customers over several years, partial capitalization may be a defensible approach. However, accounting conservatism often favors expensing, which depresses near-term profits. Regardless of treatment, management must view training costs as sunk investments that must earn a return through widespread reuse.
Due to these high upfront costs, AI firms must carefully plan their capital allocation. Not every model warrants training from scratch. Fine-tuning open-source or pre-trained models may achieve similar outcomes at a fraction of the cost. The CFO’s role is to evaluate return on invested capital in R&D and ensure technical ambition aligns with commercial opportunity.
Cash Flow Dynamics
Cash flow management in AI businesses is a significant challenge. Revenue often scales more slowly than costs in early phases. Infrastructure bills accrue monthly, while customers may still be in pilot stages. This results in negative contribution margins and high burn rates. Without discipline, rapid scaling can amplify losses.
The path to positive unit economics comes from optimization. Model compression, quantization, and batching can lower the cost per inference. Strategic use of lower-cost hardware, such as CPUs for lighter tasks, can also be beneficial. Some firms pursue vertical integration, building proprietary chips or partnering for preferential GPU pricing. Others use caching and heuristic layers to reduce the number of repeated inference calls.
Cash efficiency improves as AI companies move from experimentation to productization. Once a model stabilizes and workload patterns become predictable, cost forecasting and margin planning become more reliable. CFOs must carefully time their fundraising and growth, ensuring the company does not overbuild infrastructure before demand materializes.
Pricing Strategies
AI pricing remains an evolving art. Standard models include pay-per-use, subscription tiers with usage caps, or hybrid pricing that blends base access fees with variable usage charges. The proper structure depends on the predictability of usage, customer willingness to pay, and cost volatility.
Usage-based pricing aligns revenue with cost but increases forecasting uncertainty. Subscription pricing provides stability but can lead to margin compression if usage spikes. CFOs often employ blended approaches, utilizing base subscriptions that cover average usage, with additional fees for exceeding demand. This provides a buffer against runaway costs while maintaining customer flexibility.
Transparent pricing is crucial. Customers need clarity about what drives cost. Complexity breeds disputes and churn. Finance leaders should collaborate with product and sales teams to develop pricing models that are straightforward, equitable, and profitable. Scenario modeling helps anticipate edge cases where heavy usage erodes margins.
Valuation and Investor Perspective
Investors evaluate AI companies through a different lens than SaaS. Because AI is still an emerging field, investors look beyond current profitability and focus on technical moats, data advantages, and the scalability of cost curves. A strong AI company demonstrates three things:
- Proprietary Model or Data: Access to unique data sets or model architectures that competitors cannot easily replicate.
- Cost Curve Mastery: A clear path to reducing cost per inference as scale grows.
- Market Pull: Evidence of real-world demand and willingness to pay for intelligence-driven outcomes.
Valuations often blend software multiples with hardware-like considerations. Early AI firms may be valued at 6 to 10 times forward revenue if they show strong growth and clear cost reduction plans. Companies perceived as purely research-driven, without commercial traction, face steeper discounts. Investors are increasingly skeptical of hype and now seek proof of sustainable margins.
In diligence, investors focus on gross margin trajectory, data defensibility, and customer concentration. They ask questions like: How fast is the cost per inference declining? What portion of revenue comes from repeat customers? How dependent is the business on third-party models or infrastructure? The CFO’s job is to prepare crisp, data-backed answers.
Measuring Efficiency and Scale
AI CFOs must introduce new forms of cost accounting. Traditional SaaS dashboards that focus solely on ARR and churn are insufficient. AI demands metrics that link compute usage to financial outcomes. Examples include:
- Compute Utilization Rate: Percentage of GPU capacity effectively used.
- Model Reuse Ratio: Number of applications or customers served by a single trained model.
- Cost per Output Unit: Expense per generated item, prediction, or token.
By tying these technical metrics to revenue and gross margin, CFOs can guide engineering priorities. Finance becomes a strategic partner in improving efficiency, not just reporting cost overruns. In a later article, we will discuss complexity and Scale. I am writing a book on that subject, and this is highly relevant to how AI-based businesses are evolving. It is expected to be released by late February next year and will be available on Kindle as an e-book.
Risk Management and Uncertainty
AI companies face unique risks. Dependence on external cloud providers introduces pricing and supply risks. Regulatory scrutiny over data usage can limit access to models or increase compliance costs. Rapid technological shifts may render models obsolete before their amortization is complete. CFOs must build contingency plans, diversify infrastructure partners, and maintain agile capital allocation processes.
Scenario planning is essential. CFOs should model high, medium, and low usage cases with corresponding cost structures. Sensitivity analysis on cloud pricing, GPU availability, and demand elasticity helps avoid surprises. Resilience matters as much as growth.
The Path Forward
For AI companies, the journey to sustainable economics is one of learning curves. Every technical improvement that reduces the cost per unit enhances the margin. Every dataset that improves model accuracy also enhances customer retention. Over time, these compounding efficiencies create leverage like SaaS, but the path is steeper.
CFOs must view AI as a cost-compression opportunity. The winners will not simply have the best models but the most efficient ones. Investors will increasingly value businesses that show declining cost curves, strong data moats, and precise product-market fit.
For CEOs, the message is focus. Building every model from scratch or chasing every vertical can drain capital. The best AI firms choose their battles wisely, investing deeply in one or two defensible areas. Finance leaders play a crucial role in guiding these choices with evidence, rather than emotion.
In summary, pure AI companies operate in a world where scale is earned, not assumed. The economics are challenging but not insurmountable. With disciplined pricing, rigorous cost tracking, and clear communication to investors, AI businesses can evolve from capital-intensive experiments into enduring, high-margin enterprises. The key is turning intelligence into economics and tackling it one inference at a time.
Part III: SaaS + AI Hybrid Models: Economics and Investor Lens
In today’s market, most SaaS companies are no longer purely software providers. They are becoming intelligence platforms, integrating artificial intelligence into their products to enhance customer value. These hybrid models combine the predictability of SaaS with the innovation of AI. They hold great promises, but they also introduce new complexities in economics, margin structure, and investor expectations. For CFOs and CEOs, the challenge is not just understanding how these elements coexist but managing them in harmony to deliver profitable growth.
The hybrid SaaS-AI model is not simply the sum of its parts. It requires balancing two different economic engines: one that thrives on recurring, high-margin revenue and another that incurs variable costs linked to compute usage. The key to success lies in recognizing where AI enhances value and where it risks eroding profitability. Leaders who can measure, isolate, and manage these dynamics can unlock superior economics and investor confidence.
The Nature of Hybrid SaaS-AI Businesses
A hybrid SaaS-AI company starts with a core subscription-based platform. Customers pay recurring fees for access, support, and updates. Additionally, the company leverages AI-powered capabilities to enhance automation, personalization, analytics, and decision-making. These features can be embedded into existing workflows or offered as add-ons, sometimes billed based on usage.
Examples include CRMs with AI-assisted forecasting, HR platforms with intelligent candidate screening, or project tools with predictive insights. In each case, AI transforms user experience and perceived value, but it also introduces incremental cost per transaction. Every inference call, data model query, or real-time prediction consumes compute power and storage.
This hybridization reshapes the traditional SaaS equation. Revenue predictability remains strong due to base subscriptions, but gross margins become more variable. CFOs must now consider blended margins and segment economics. The task is to ensure that AI features expand total lifetime value faster than they inflate cost-to-serve.
Dual Revenue Streams and Pricing Design
Hybrid SaaS-AI companies often operate with two complementary revenue streams:
- Subscription Revenue: Fixed or tiered recurring revenue, predictable and contract-based.
- Usage-Based Revenue: Variable income tied to AI consumption, such as per query, token, or transaction.
This dual model offers flexibility. Subscriptions provide stability, while usage-based revenue captures upside from heavy engagement. However, it also complicates forecasting. CFOs must model revenue variance under various usage scenarios and clearly communicate these assumptions to the Board and investors.
Pricing design becomes a strategic lever. Some firms include AI features in premium tiers to encourage upgrades. Others use consumption pricing, passing compute costs directly to customers. The right approach depends on customer expectations, cost structure, and product positioning. For enterprise markets, predictable pricing is often a preferred option. For developer- or API-driven products, usage-based pricing aligns better with the delivery of value.
The most effective hybrid models structure pricing so that incremental revenue per usage exceeds incremental cost per usage. This ensures positive unit economics across both streams. Finance teams should run sensitivity analyses to test break-even points and adjust thresholds as compute expenses fluctuate.
Gross Margin Bifurcation
Gross margin in hybrid SaaS-AI companies must be analyzed in two layers:
- SaaS Core Margin: Typically, 75 to 85 percent is driven by software delivery, hosting, and support.
- AI Layer Margin: Often 40 to 60 percent, and it depends on compute efficiency and pricing.
When blended, the total margin may initially decline, especially if AI usage grows faster than subscription base revenue. The risk is that rising compute costs erode profitability before pricing can catch up. To manage this, CFOs should report segmented gross margins to the Board. This transparency helps avoid confusion when consolidated margins fluctuate.
The goal is not to immediately maximize blended margins, but to demonstrate a credible path toward margin expansion through optimization. Over time, as AI models become more efficient and the cost per inference declines, blended margins can recover. Finance teams should measure and communicate progress in terms of margin improvement per usage unit, not just overall percentages.
Impact on Customer Economics
AI features can materially improve customer economics. They increase stickiness, reduce churn, and create opportunities for upsell. A customer who utilizes AI-driven insights or automation tools is more likely to renew, as the platform becomes an integral part of their workflow. This improved retention directly translates into a higher lifetime value.
In some cases, AI features can also justify higher pricing or premium tiers. The key is measurable value. Customers pay more when they see clear ROI: for example, faster decision-making, labor savings, or improved accuracy. CFOs should work with product and customer success teams to quantify these outcomes and use them in renewal and pricing discussions.
The critical financial question is whether AI-enhanced LTV grows faster than CAC and variable cost. If so, AI drives profitable growth. If not, it becomes an expensive feature rather than a revenue engine. Regular cohort analysis helps ensure that AI adoption is correlated with improved unit economics.
Operating Leverage and Efficiency
Hybrid SaaS-AI companies must rethink operating leverage. Traditional SaaS gains leverage by spreading fixed costs over recurring revenue. In contrast, AI introduces variable costs tied to usage. This weakens the traditional leverage model. To restore it, finance leaders must focus on efficiency levers within AI operations.
Techniques such as caching, batching, and model optimization can reduce compute costs per request. Partnering with cloud providers for reserved capacity or leveraging model compression can further improve cost efficiency. The finance team’s role is to quantify these savings and ensure engineering priorities align with economic goals.
Another form of leverage comes from data reuse. The more a single model or dataset serves multiple customers or use cases, the higher the effective ROI on data and training investment. CFOs should track data utilization ratios and model reuse metrics as part of their financial dashboards.
Cash Flow and Capital Planning
Cash flow in hybrid businesses depends on the balance between stable subscription inflows and variable infrastructure outflows. CFOs must forecast not only revenue but also compute consumption. During early rollout, AI usage can spike unpredictably, leading to cost surges. Scenario planning is essential. Building buffers into budgets prevents margin shocks.
Capital allocation should prioritize scalability. Investments in AI infrastructure should follow demonstrated demand, not speculative projections. Over-provisioning GPU capacity can result in unnecessary cash expenditures. Many firms start with cloud credits or pay-as-you-go models before committing to long-term leases or hardware purchases. The objective is to match the cost ramp with revenue realization.
As with SaaS, negative working capital from annual prepayments can be used to fund expansion. However, CFOs should reserve portions of this cash for compute variability and cost optimization initiatives.
Investor Perspective
Investors view hybrid SaaS-AI models with both enthusiasm and scrutiny. They appreciate the potential for differentiation and pricing power, but expect clear evidence that AI integration enhances, rather than dilutes, economics. The investment thesis often centers on three questions:
- Does AI materially increase customer lifetime value?
- Can the company sustain or improve gross margins as AI usage scales?
- Is there a clear path to efficient growth under the Rule of 40?
Companies that answer yes to all three earn premium valuations. Investors will typically apply core SaaS multiples (5 to 8 times Annual Recurring Revenue, or ARR) with modest uplifts if AI features drive measurable revenue growth. However, if AI costs are poorly controlled or margins decline, valuations compress quickly.
To maintain investor confidence, CFOs must provide transparency. This includes segmented reporting, sensitivity scenarios, and clear explanations of cost drivers. Investors want to see not just innovation, but financial stewardship.
Strategic Positioning
The strategic role of AI within a SaaS company determines how investors perceive it. There are three broad positioning models:
- AI as a Feature: Enhances existing workflows but is not core to monetization. Example: an email scheduling tool with AI suggestions.
- AI as a Co-Pilot: Drives user productivity and becomes central to customer experience. Example: CRM with AI-generated insights.
- AI as a Platform: Powers entire ecosystems and opens new revenue lines. Example: a developer platform offering custom AI models.
Each model carries different costs and pricing implications. CFOs should ensure that the company’s financial model aligns with its strategic posture. A feature-based AI approach should be margin-accretive. A platform-based approach may accept lower margins initially in exchange for future ecosystem revenue.
Risk Management and Governance
Hybrid models also introduce new risks. Data privacy, model bias, and regulatory compliance can create unexpected liabilities. CFOs must ensure robust governance frameworks are in place. Insurance, audit, and legal teams should work closely together to manage exposure effectively. Transparency in AI decision-making builds customer trust and reduces reputational risk.
Another risk is dependency on third-party models or APIs. Companies that use external large language models face risks related to cost and reliability. CFOs should evaluate the total cost of ownership between building and buying AI capabilities. Diversifying across providers or developing proprietary models can mitigate concentration risk.
The CFO’s Role
In hybrid SaaS-AI organizations, the CFO’s role expands beyond financial reporting. Finance becomes the integrator of technology, strategy, and economics. The CFO must help design pricing strategies, measure the cost-to-serve, and effectively communicate value to investors. This requires fluency in both financial and technical language.
Regular dashboards should include metrics such as blended gross margin, compute cost per user, AI utilization rate, and LTV uplift resulting from AI adoption. This data-driven approach allows management to make informed trade-offs between innovation and profitability.
The CFO also acts as an educator. Boards and investors may not yet be familiar with AI-driven cost structures. Clear, simple explanations build confidence and support strategic decisions.
The Path Forward
The future belongs to companies that combine SaaS predictability with AI intelligence. Those who succeed will treat AI not as a novelty but as an economic engine. They will manage AI costs with the same rigor they apply to headcount or cloud spend. They will design pricing that reflects value creation, not just usage volume. And they will communicate to investors how each new AI feature strengthens the overall financial model.
Hybrid SaaS-AI companies occupy the forefront of modern business economics. They demonstrate that innovation and discipline are not opposites, but they are partners working toward a common objective. For CFOs and CEOs, the path forward is clear: measure what matters, value price, and guide the organization with transparency and foresight. Over time, this combination of creativity and control will separate enduring leaders from experimental wanderers.
Summary
In every business model, clarity around unit economics forms the foundation for sound decision-making. Whether one is building a SaaS company, an AI company, or a hybrid of both, understanding how revenue and costs behave at the most granular level allows management to design operations and financial models that scale intelligently. Without that clarity, growth becomes noise and is not sustainable.
From years of working across SaaS businesses, I have seen firsthand how the model rewards discipline. Predictable recurring revenue, high gross margins, and scalable operating leverage create a compounding effect when managed carefully. The challenge lies in balancing acquisition cost, retention, and cash efficiency, so that each new unit of growth strengthens rather than strains the business.
In AI, the economic story changes. Here, each unit of output incurs tangible costs, such as computation, data, and inference. The path to profitability lies not in volume alone, but in mastering the cost curve. Efficiency, model reuse, and pricing alignment become as critical as sales growth. AI firms must show investors that scaling demand will compress, not inflate, the cost per unit. I have no clue how they intend to do that with GPU demand going through the roof, but in this article, let us assume for giggles that there will be a light at the end of the tunnel, and GPU costs will temper down so it can fuel AI-driven business.
For hybrid SaaS-AI businesses, success depends on integration. AI should deepen customer value, expand lifetime revenue, and justify incremental costs. CFOs and CEOs must manage dual revenue streams, measure blended margins, and communicate transparently with investors about both the promise and the trade-offs of AI adoption.
Ultimately, understanding economics is knowing the truth. I am an economist, and I like to think I am unbiased. It enables leaders to align ambition with reality and design financial models that convey a credible narrative. As the lines between SaaS and AI continue to blur, those who understand the economics underlying innovation will be best equipped to build companies that endure.

Operational Excellence: Drive Margin without Raising Prices
Finding Margin in the Middle: How to Drive Profit Without Price Hikes
In a market where inflation spooks buyers, competitors slash to gain share, and customers have more tools than ever to comparison-shop, raising prices is no longer the first, easiest, or even smartest lever to grow profit. Instead, margin must increasingly be found, not forced. And it must be found in the middle, which is generally found in the often-overlooked core of the operating model where process, precision, and practical finance intersect.
There is a reason why Warren Buffett often talks about companies with “pricing power.” He is right. But for most businesses, particularly in crowded or commoditized industries, pricing power is earned slowly and spent carefully. You cannot simply hike prices every quarter and expect customer loyalty or competitive positioning to stay intact. Eventually, elasticity catches up, and the top-line gains are eaten away by churn, discounting, or brand erosion.
So where does a wise CFO turn when pricing is off-limits?
They turn inward. They look beyond the sticker price and focus on margin mechanics. Margin mechanics refers to the intricate chain of operational, behavioral, and financial factors that, when optimized, deliver profitability gains without raising prices or compromising customer experience.
1. Customer and Product Segmentation
Not all revenue is created equal. Some customers consistently require more service, more concessions, or more overhead to maintain. Some products, while flashy, produce poor contribution margins due to complexity, customization, or low attach rates.
A margin-focused CFO builds a profitability heat map that resembles a matrix of customers, products, and channels, sorted not by revenue, but by gross margin and fully loaded cost to serve. Often, this surfaces surprising truths: the top-line star customer may be draining resources, while smaller customers yield quiet, repeatable profits.
Armed with this, finance leaders can:
- Encourage marketing and sales to prioritize “sweet spot” customers.
- Redirect promotions away from margin-dilutive SKUs.
- Discontinue or reprice long-tail products that erode EBITDA.
The magic is that no pricing change is needed. You’re optimizing mix, not increasing cost to the customer.
2. Revenue Operations Discipline
Most finance teams over-index on financial outcomes and under-index on how revenue is produced. Revenue is a function of lead quality, conversion rates, onboarding speed, renewal behavior, and account expansion.
Small inefficiencies compound. A two-week onboarding delay slows revenue recognition. A 5% lower renewal rate in one segment turns into millions in churn over time. A poorly targeted promotion draws in low-value users.
CFOs can work with revenue operations to improve:
- Sales velocity: Track sales cycle time and identify friction points.
- Sales productivity: Compare bookings per rep and subsequently adjust territory or quota strategies accordingly.
- Customer expansion paths: Analyze time-to-upgrade across cohorts and incentivize actions that accelerate it.
These are margin levers disguised as go-to-market metrics. Fixing them grows contribution margin without touching list prices.
3. Variable Cost Optimization
In many businesses, fixed costs are scrutinized with zeal, while variable costs sneak by unchallenged. But margin improvement often comes from managing the slope, not just the intercept.
Ask:
- Are your support costs scaling linearly with customer growth?
- Are third-party services like cloud, logistics, and payments growing faster than revenue?
- Are your service delivery models optimized for cost-to-serve by segment?
Consider the SaaS company that offers phone support to all users. By introducing tiered support, for example, live help for enterprises, self-serve for SMBs, it cuts the support cost per ticket by 30% and sees no drop in NPS. No price hike. Just better alignment between cost and value delivered.
There is an excellent YouTube video detailing how Zendesk transitioned to this model, which reduced costs, improved focus, and enabled smarter “land and expand” strategies for the GTM team.
4. Micro-Incentives and Behavioral Engineering
Margin lives in behavior. The way customers buy, the way employees discount, and the way usage unfolds are driven by incentives.
Take discounting. Sales reps often discount more than necessary, mainly out of fear of losing the deal or a reflexive habit of “close by any means possible”. Introduce approval workflows, better deal-scoring tools, and training on value-selling, and you will likely reduce unnecessary margin erosion.
Or consider customer behavior. A freemium product may cost more in support and infrastructure than it brings in downstream. By adjusting onboarding flows or nudging users into monetized tiers sooner, you reshape unit economics.
These are examples of behavioral engineering, which are minor design changes that improve how humans interact with your systems. The CFO can champion this by testing, measuring, and codifying what works. The cumulative effect on margin is real and repeatable.
5. Forecasting Cost-to-Serve with Precision
Finance teams often model revenue in detail but treat the cost of delivery as a fixed assumption. That is a mistake.
CFOs can partner with operations to build granular, dynamic models of cost-to-serve across customer segments, usage tiers, and service types. This enables:
- Proactive routing of low-margin segments to more efficient delivery models.
- Early warning on accounts that are becoming margin negative.
- Scenario modeling to test how changes in volume or behavior affect gross margin.
With this clarity, even pricing conversations become more strategic. You may not raise prices, but you may adjust packaging or terms to protect profitability.
6. Eliminating Internal Friction
Organizations bleed margins through internal friction due to manual processes, approval delays, redundant tools, and a lack of integration.
A CFO looking to expand margin without raising prices should conduct an internal friction audit:
- Where are we spending time, not just money?
- Which tools overlap?
- Which processes create avoidable delays or rework?
Every hour saved in collections, procurement approvals, and financial close contributes to margin by freeing up capacity and accelerating throughput. These gains are invisible to customers but visible on the profit and loss (P&L) statement.
7. Precision Budgeting and Cost Discipline
Finally, no discussion of margin is complete without cost control. But this is not about blanket cuts. It is about precision: the art and science of knowing which costs are truly variable, which drive ROI, and which can be deferred or restructured.
The CFO must move budgeting from a fixed annual ritual to a living process:
- Use rolling forecasts that adjust with real-time data.
- Tie spend approvals to milestone achievement, not just time.
- Benchmark cost centers against peers or past performance with clarity.
In this way, costs become not just something to report—but something to shape.

The Best Margin Is Invisible to the Customer
When you raise prices, customers notice. Sometimes they pay more. Sometimes they churn. However, when you achieve margin through operational excellence, behavioral discipline, and data-driven decisions, the customer remains none the wiser. And your business grows stronger without risking the front door.
This is the subtle, often-overlooked genius of modern financial leadership. Margin expansion is not always about dramatic decisions. It is about understanding where value is created, where it is lost, and how to gently nudge the machine toward higher efficiency, higher yield, and higher resilience.
Before calling a pricing meeting, consider holding a discovery session. Pull your data. Map your unit economics. Audit your funnel. Examine your cost structure. Trace your customer journey. Somewhere, there is a margin waiting to be found.
And it might just be the most profitable thing you do this year without changing a single price tag.

Transforming CFO Roles into Internal Venture Capitalists
I learned early in my career that capital is more than balance and flow. It is the spark that can ignite ambition or smother possibility. During my graduate studies in finance and accounting, I treated projects as linear investments with predictable returns. Yet, across decades in global operating and FP&A roles, I came to see that business is not linear. It progresses in phases, through experiments, serendipity, and choices that either accelerate or stall momentum. Along the way, I turned to literature that shaped my worldview. I grew familiar with Geoffrey West’s Scale, which taught me to see companies as complex adaptive systems. I devoured “The Balanced Scorecard ” and “Measure What Matters,” which helped me integrate strategy with execution. I studied Hayek, Mises, and Keynes, and found in their words the tension between freedom and structure that constantly shapes business decisions. In my recent academic detour into data analytics at Georgia Tech, I discovered the tools I needed to model ambiguity in a world where uncertainty is the norm.
This rich intellectual fabric informs my belief that finance must behave like an internal venture capitalist. The traditional role of the CFO often resembled a gatekeeper. We controlled capital, enforced discipline, and ensured compliance. But compliance alone does not drive growth. It manages risk. What the modern CFO must offer is structured exploration. We must fund bets, define guardrails, measure outcomes, and redeploy capital against the most successful experiments. And just as external investors sunset underperforming ventures, internal finance must have the courage to pull the plug on underwhelming initiatives, not as punishment, but as deliberate reallocation of attention and energy.

The internal-VC mindset positions finance at the intersection of strategy, data, and execution. It is not about checklists. It is about pattern recognition. It is not about spreadsheets. It is about framing. And it is not about silence. It is about active dialogue with product owners, marketers, sales leaders, analysts, engineers, and legal counsel. To be an internal venture capitalist requires two shifts. One is cognitive. We must see every budget allocation as a discrete business experiment with its own risk profile and value potential. The second shift is cultural. We must build circuits of accountability, learning, and decision velocity that match our capital cadence.
My journey toward this philosophy began when I realized that capital allocations in corporate settings often followed the path of least resistance. Teams that worked well together or those that asked loudly received priority. Others faded until the next planning cycle. That approach may work in stable environments. It fails gloriously in high-velocity, venture-backed companies. In those settings, experimentation must be systematic, not happenstance.
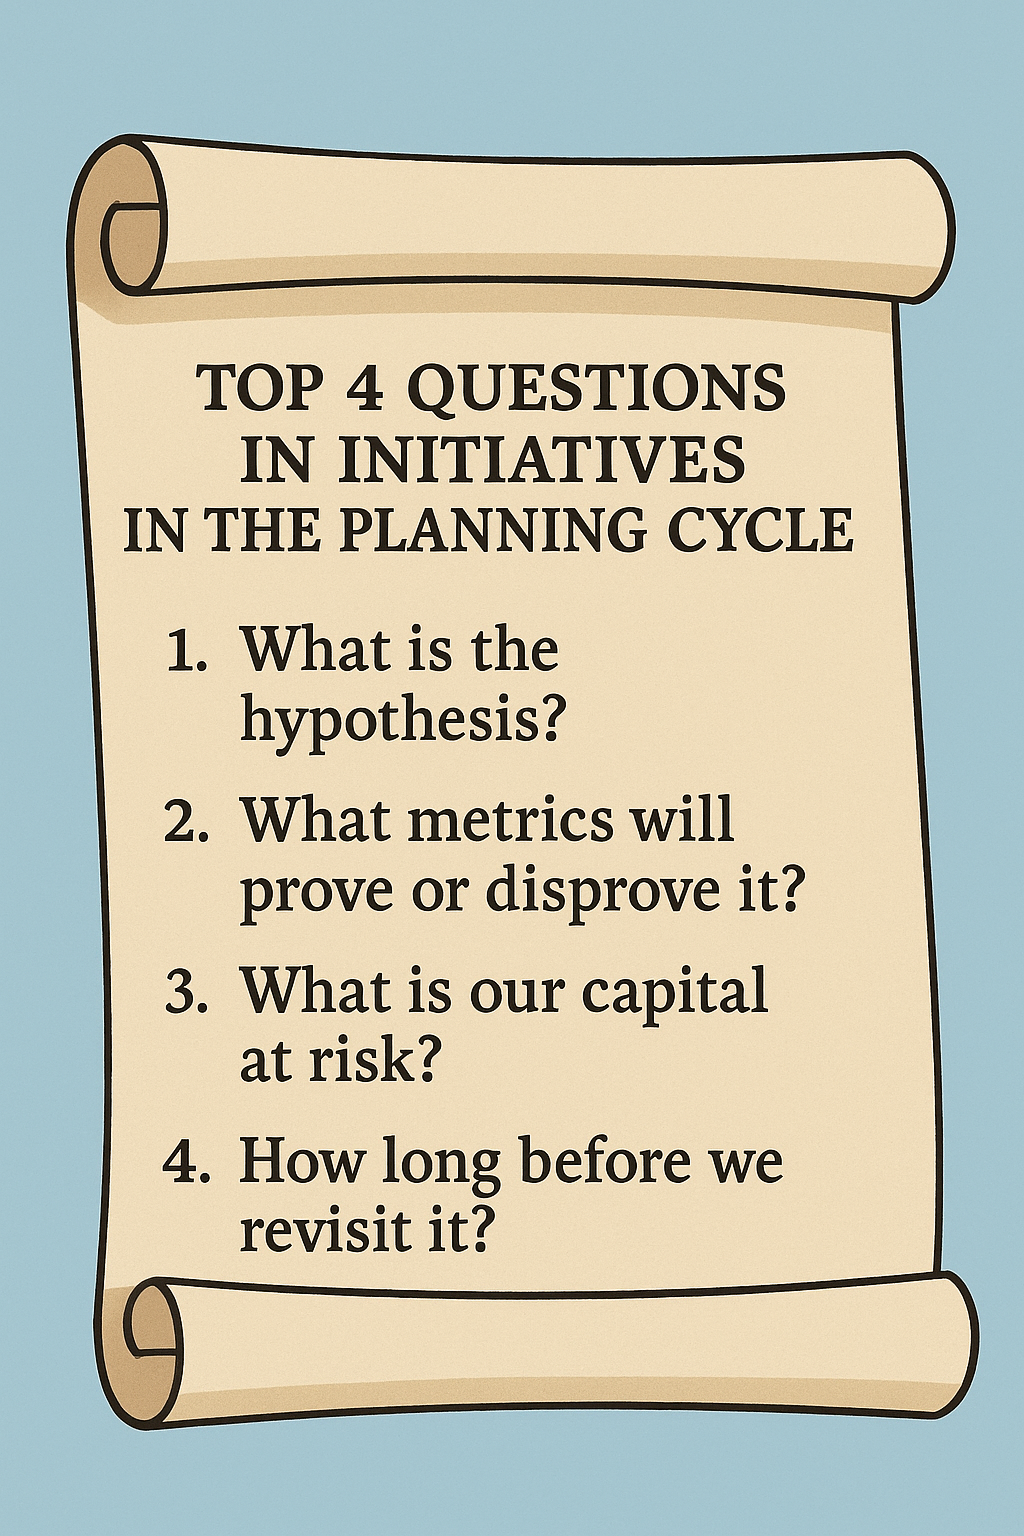
So I began building a simple framework with my FP&A teams. Every initiative, whether product expansion, marketing pilot, or infrastructure build, entered the planning process as an experiment.
We asked four questions: What is the hypothesis? What metrics will prove or disprove it? What is our capital at risk? And how long before we revisit it? We mandated a three-month trial period for most efforts. We developed minimal viable KPIs. We built lightweight dashboards that tracked progress. We used SQL and R to analyze early signals. We brought teams in for biweekly check-ins. Experiment status did not remain buried in a spreadsheet. We published it alongside pipeline metrics and cohort retention curves.
This framework aligned closely with ideas I first encountered in The Execution Premium. Strategy must connect to measurement. Measurement must connect to resource decisions. In external venture capital, the concept is straightforward: money flows to experiments that deliver results. In internal operations, we often treat capital as a product of the past. That must change. We must fund with intention. We must measure with rigor. We must learn at pace. And when experiments succeed, we scale decisively. When they fail, we reallocate quickly and intelligently.
One internal experiment I recently led involved launching a tiered pricing add-on. The sales team had anecdotal feedback from prospects. The product team wanted space to test. And finance wanted to ensure margin resilience. We framed this as a pilot rather than a formal release. We developed a compact P&L model that simulated the impact on gross margin, NRR sensitivity, and churn risk. We set a two-month runway and tracked usage and customer feedback in near real time. And when early metrics showed that a small segment of customers was willing to pay a premium without increasing churn, we doubled down and fast-tracked the feature build. It scaled within that quarter.
This success came from intentional framing, not luck. It came from seeing capital allocation as orchestration, not allotment. It came from embedding finance deep into decision cycles, not simply reviewing outputs. It came from funding quickly, measuring quickly, and adjusting even faster.
That is what finance as internal VC looks like. It does not rely on permission. It operates with purpose.
Among the books that shaped my thinking over the decades, Scale, The Balanced Scorecard, and Measure What Matters stood out. Scale taught me to look for leverage points in systems rather than single knobs. The Balanced Scorecard reminded me that value is multidimensional. Measure What Matters reinforced the importance of linking purpose with performance. Running experiments internally draws directly from those ideas, weaving systems thinking with strategic clarity and an outcome-oriented approach.
If you lead finance in a Series A, B, or C company, ask yourself whether your capital allocation process behaves like a venture cycle or a budgeting ritual. Do you fund pilots with measurable outcomes? Do you pause bets as easily as you greenlight them? Do you embed finance as an active participant in the design process, or simply as a rubber stamp after launch? If not, you risk becoming the bottleneck, not the catalyst.
As capital flows faster and expectations rise higher for Series A through D companies, finance must evolve from a back-office steward to an active internal investor. I recall leading a capital review where representatives from product, marketing, sales, and finance came together to evaluate eight pilot projects. Rather than default to “fund everything,” we applied simple criteria based on learnings from works like The Lean Startup and Thinking in Bets. We asked: If this fails, what will we learn? If this succeeds, what capabilities will scale? We funded three pilots, deferred two, and sunsetted one. The deferrals were not rejections. They were timely reflections grounded in probability and pragmatism.
That decision process felt unconventional initially. Leaders expect finance to compute budgets, not coach choices. But that shift in mindset unlocked several outcomes in short order. First, teams began designing their proposals around hypotheses rather than hope. Second, they began seeking metric alignment earlier. And third, they showed new respect for finance—and not because we held the purse strings, but because we invested intention and intellect, not just capital.
To sustain that shift, finance must build systems for experimentation. I came to rely on three pillars: capital scoring, cohort ROI tracking, and disciplined sunset discipline. Capital scoring means each initiative is evaluated based on risk, optionality, alignment with strategy, and time horizon. We assign a capital score and publish it alongside the ask. This forces teams to pause. It sparks dialogue.
Cohort ROI tracking means we treat internal initiatives like portfolio lines. We assign a unique identifier to every project and track KPIs by cohort over time. This allowed us to understand not only whether the experiment succeeded, but also which variables: segment, messaging, feature scope, or pricing-driven outcomes. That insight fashions future funding cycles.
Sunset discipline is the hardest. We built expiration triggers into every pitch. We set calendar checkpoints. If the metrics do not indicate forward progress, the initiative is terminated. Without that discipline, capital accumulates, and inertia settles. With it, capital remains fluid, and ambitious teams learn more quickly.
These operational tools combined culture and structure. They created a rhythm that felt venture-backed and venture-smart, not simply operational. They further closed the distance between finance and innovation.
At one point, the head of product slid into my office. He said, “I feel like we are running experiments at the speed of ideas, not red tape.” That validation meant everything. And it only happened because we chose to fund with parameters, not promote with promises.
But capital is not the sole currency. Information is equal currency. Finance must build metrics infrastructure to support internal VC behavior. We built a “value ledger” that connected capital flows to business outcomes. Each cohort linked capital expenditure to customer acquisition, cost-to-serve, renewal impact, and margin projection. We pulled data from Salesforce, usage logs, and billing systems—sometimes manually at first—into simple, weekly-updated dashboards. This visual proximity reduced friction. Task owners saw the impact of decisions across time, not just in retrospective QBRs.
I drew heavily on my analytics training at the Georgia Institute of Technology for this. I used R to run time series on revenue recognition patterns. I used Arena to model multi-cohort burn, headcount scaling, and feature adoption. These tools translated the capital hypothesis into numerical evidence. They didn’t require AI. They needed discipline and a systems perspective.
Embedded alongside metrics, we also built a learning ritual. Every quarter, we held a “portfolio learning day.” All teams presented successes, failures, surprises, and subsequent bets. Engineering leaders shared how deployment pipelines impacted adoption. Customer success directors shared early signs of account expansion. Sales leaders shared win-rate anomalies against cohort tags. Finance hosted, not policed. We shared capital insights, not criticism. Over time, the portfolio day became a highly coveted ritual, serving as a refresher on collective strategy and emergent learning.
The challenge we faced was calibration. Too few experiments meant growth moves slowly. Too many created confusion. We learned to apply portfolio theory: index some bets to the core engine, keep others as optional, and let a few be marginal breakers. Finance segmented investments into Core, Explore, and Disrupt categories and advised on allocation percentages. We didn’t fix the mix. We tracked it. We nudged, not decreed. That alignment created valuation uplift in board conversations where growth credibility is a key metric.
Legal and compliance leaders also gained trust through this process. We created templated pilot agreements that embedded sunset clauses and metrics triggers. We made sunset not an exit, but a transition into new funding or retirement. Legal colleagues appreciated that we reduced contract complexity and trimmed long-duration risk. That cross-functional design meant internal VC behavior did not strain governance, but it strengthened it.
By the time this framework matured at Series D, we no longer needed to refer to it as “internal VC.” It simply became the way we did business. We stopped asking permission. We tested and validated fast. We pulled ahead in execution while maintaining discipline. We did not escape uncertainty. We embraced it. We harnessed it through design.
Modern CFOs must ask themselves hard questions. Is your capital planning a calendar ritual or a feedback system? Do you treat projects as batch allocations or timed experiments? Do you bury failure or surface it as insight? If your answer flags inertia, you need to infuse finance with an internal VC mindset.
This approach also shapes FP&A culture. Analysts move from variance detectives to learning architects. They design evaluation logic, build experiment dashboards, facilitate retrospectives, and coach teams in framing hypotheses. They learn to act more like consultants, guiding experimentation rather than policing spreadsheets. That shift also motivates talent; problem solvers become designers of possibilities.
When I reflect on my intellectual journey, from the Austrian School’s view of market discovery to complexity theory’s paradox of order, I see finance as a creative, connective platform. It is not just about numbers. It is about the narrative woven between them. When the CFO can say “yes, if…” rather than “no,” the organization senses an invitation rather than a restriction. The invitation scales faster than any capital line.
That is the internal VC mission. That is the modern finance mandate. That is where capital becomes catalytic, where experiments drive compound impact, and where the business within the business propels enterprise-scale growth.
The internal VC experiment is ongoing. Even now, I refine the cadence of portfolio days. Even now, I question whether our scoring logic reflects real optionality. Even now, I sense a pattern in data and ask: What are we underfunding for future growth? CFOs who embrace internal VC behavior find themselves living at the liminal point between what is and what could be. That is both exhilarating and essential.
If this journey moves you, reflect on your own capital process. Where can you embed capital scoring, cohort tracking, and sunset discipline? Where can you shift finance from auditor to architect? Where can you help your teams see not just what they are building, but why it matters, how it connects, and what they must learn next?
I invite you to share those reflections with your network and to test one pilot in the next 30 days. Run it with capital allocation as a hypothesis, metrics as feedback, and finance as a partner. That single experiment may open the door to the next stage of your company’s growth.
The CFO as Chief Option Architect: Embracing Uncertainty
Part I: Embracing the Options Mindset
This first half explores the philosophical and practical foundation of real options thinking, scenario-based planning, and the CFO’s evolving role in navigating complexity. The voice is grounded in experience, built on systems thinking, and infused with a deep respect for the unpredictability of business life.
I learned early that finance, for all its formulas and rigor, rarely rewards control. In one of my earliest roles, I designed a seemingly watertight budget, complete with perfectly reconciled assumptions and cash flow projections. The spreadsheet sang. The market didn’t. A key customer delayed a renewal. A regulatory shift in a foreign jurisdiction quietly unraveled a tax credit. In just six weeks, our pristine model looked obsolete. I still remember staring at the same Excel sheet and realizing that the budget was not a map, but a photograph, already out of date. That moment shaped much of how I came to see my role as a CFO. Not as controller-in-chief, but as architect of adaptive choices.

The world has only become more uncertain since. Revenue operations now sit squarely in the storm path of volatility. Between shifting buying cycles, hybrid GTM models, and global macro noise, what used to be predictable has become probabilistic. Forecasting a quarter now feels less like plotting points on a trendline and more like tracing potential paths through fog. It is in this context that I began adopting and later, championing, the role of the CFO as “Chief Option Architect.” Because when prediction fails, design must take over.
This mindset draws deeply from systems thinking. In complex systems, what matters is not control, but structure. A system that adapts will outperform one that resists. And the best way to structure flexibility, I have found, is through the lens of real options. Borrowed from financial theory, real options describe the value of maintaining flexibility under uncertainty. Instead of forcing an all-in decision today, you make a series of smaller decisions, each one preserving the right, but not the obligation, to act in a future state. This concept, though rooted in asset pricing, holds powerful relevance for how we run companies.
When I began modeling capital deployment for new GTM motions, I stopped thinking in terms of “budget now, or not at all.” Instead, I started building scenario trees. Each branch represented a choice: deploy full headcount at launch or split into a two-phase pilot with a learning checkpoint. Invest in a new product SKU with full marketing spend, or wait for usage threshold signals to pass before escalation. These decision trees capture something that most budgets never do—the reality of the paths not taken, the contingencies we rarely discuss. And most importantly, they made us better at allocating not just capital, but attention. I am sharing my Bible on this topic, which was referred to me by Dr. Alexander Cassuto at Cal State Hayward in the Econometrics course. It was definitely more pleasant and easier to read than Jiang’s book on Econometrics.
This change in framing altered my approach to every part of revenue operations. Take, for instance, the deal desk. In traditional settings, deal desk is a compliance checkpoint where pricing, terms, and margin constraints are reviewed. But when viewed through an options lens, the deal desk becomes a staging ground for strategic bets. A deeply discounted deal might seem reckless on paper, but if structured with expansion clauses, usage gates, or future upsell options, it can behave like a call option on account growth. The key is to recognize and price the option value. Once I began modeling deals this way, I found we were saying “yes” more often, and with far better clarity on risk.
Data analytics became essential here not for forecasting the exact outcome, but for simulating plausible ones. I leaned heavily on regression modeling, time-series decomposition, and agent-based simulation. We used R to create time-based churn scenarios across customer cohorts. We used Arena to simulate resource allocation under delayed expansion assumptions. These were not predictions. They were controlled chaos exercises, designed to show what could happen, not what would. But the power of this was not just in the results, but it was in the mindset it built. We stopped asking, “What will happen?” and started asking, “What could we do if it does?”
From these simulations, we developed internal thresholds to trigger further investment. For example, if three out of five expansion triggers were fired, such as usage spike, NPS improvement, and additional department adoption, then we would greenlight phase two of GTM spend. That logic replaced endless debate with a predefined structure. It also gave our board more confidence. Rather than asking them to bless a single future, we offered a roadmap of choices, each with its own decision gates. They didn’t need to believe our base case. They only needed to believe we had options.
Yet, as elegant as these models were, the most difficult challenge remained human. People, understandably, want certainty. They want confidence in forecasts, commitment to plans, and clarity in messaging. I had to coach my team and myself to get comfortable with the discomfort of ambiguity. I invoked the concept of bounded rationality from decision science: we make the best decisions we can with the information available to us, within the time allotted. There is no perfect foresight. There is only better framing.
This is where the law of unintended consequences makes its entrance. In traditional finance functions, overplanning often leads to rigidity. You commit to hiring plans that no longer make sense three months in. You promise CAC thresholds that collapse under macro pressure. You bake linearity into a market that moves in waves. When this happens, companies double down, pushing harder against the wrong wall. But when you think in options, you pull back when the signal tells you to. You course-correct. You adapt. And paradoxically, you appear more stable.
As we embedded this thinking deeper into our revenue operations, we also became more cross-functional. Sales began to understand the value of deferring certain go-to-market investments until usage signals validated demand. Product began to view feature development as portfolio choices: some high-risk, high-return, others safer but with less upside. Customer Success began surfacing renewal and expansion probabilities not as binary yes/no forecasts, but as weighted signals on a decision curve. The shared vocabulary of real options gave us a language for navigating ambiguity together.
We also brought this into our capital allocation rhythm. Instead of annual budget cycles, we moved to rolling forecasts with embedded thresholds. If churn stayed below 8% and expansion held steady, we would greenlight an additional five SDRs. If product-led growth signals in EMEA hit critical mass, we’d fund a localized support pod. These weren’t whims. They were contingent commitments, bound by logic, not inertia. And that changed everything.
The results were not perfect. We made wrong bets. Some options expired worthless. Others took longer to mature than we expected. But overall, we made faster decisions with greater alignment. We used our capital more efficiently. And most of all, we built a culture that didn’t flinch at uncertainty—but designed for it.
In the next part of this essay, I will go deeper into the mechanics of implementing this philosophy across the deal desk, QTC architecture, and pipeline forecasting. I will also show how to build dashboards that visualize decision trees and option paths, and how to teach your teams to reason probabilistically without losing speed. Because in a world where volatility is the only certainty, the CFO’s most enduring edge is not control, but it is optionality, structured by design and deployed with discipline.
Part II: Implementing Option Architecture Inside RevOps
A CFO cannot simply preach agility from a whiteboard. To embed optionality into the operational fabric of a company, the theory must show up in tools, in dashboards, in planning cadences, and in the daily decisions made by deal desks, revenue teams, and systems owners. I have found that fundamental transformation comes not from frameworks, but from friction—the friction of trying to make the idea work across functions, under pressure, and at scale. That’s where option thinking proves its worth.
We began by reimagining the deal desk, not as a compliance stop but as a structured betting table. In conventional models, deal desks enforce pricing integrity, review payment terms, and ensure T’s and C’s fall within approved tolerances. That’s necessary, but not sufficient. In uncertain environments—where customer buying behavior, competitive pressure, or adoption curves wobble without warning: rigid deal policies become brittle. The opportunity lies in recasting the deal desk as a decision node within a larger options tree.
Consider a SaaS enterprise deal involving land-and-expand potential. A rigid model forces either full commitment upfront or defers expansion, hoping for a vague “later.” But if we treat the deal like a compound call option, we see more apparent logic. You price the initial land deal aggressively, with usage-based triggers that, when met, unlock favorable expansion terms. You embed a re-pricing clause if usage crosses a defined threshold in 90 days. You insert a “soft commit” expansion clause tied to the active user count. None of these is just a term. They are embedded with real options. And when structured well, they deliver upside without requiring the customer to commit to uncertain future needs.
In practice, this approach meant reworking CPQ systems, retraining legal, and coaching reps to frame options credibly. We designed templates with optionality clauses already coded into Salesforce workflows. Once an account crossed a pre-defined trigger say, 80% license utilization, then the next best action flowed to the account executive and customer success manager. The logic wasn’t linear. It was branching. We visualized deal paths in a way that corresponds to mapping a decision tree in a risk-adjusted capital model.
Yet even the most elegant structure can fail if the operating rhythm stays linear. That is why we transitioned away from rigid quarterly forecasts toward rolling scenario-based planning. Forecasting ceased to be a spreadsheet contest. Instead, we evaluated forecast bands, not point estimates. If base churn exceeded X% in a specific cohort, how did that impact our expansion coverage ratio? If deal velocity in EMEA slowed by two weeks, how would that compress the bookings-to-billings gap? We visualized these as cascading outcomes, not just isolated misses.
To build this capability, we used what I came to call “option dashboards.” These were layered, interactive models with inputs tied to a live pipeline and post-sale telemetry. Each card on the dashboard represented a decision node—an inflection point. Would we deploy more headcount into SMB if the average CAC-to-LTV fell below 3:1? Would we pause feature rollout in one region to redirect support toward a segment with stronger usage signals? Each choice was pre-wired with boundary logic. The decisions didn’t live in a drawer—they lived in motion.
Building these dashboards required investment. But more than tools, it required permission. Teams needed to know they could act on signal, not wait for executive validation every time a deviation emerged. We institutionalized the language of “early signal actionability.” If revenue leaders spotted a decline in renewal health across a cluster of customers tied to the same integration module, they didn’t wait for a churn event. They pulled forward roadmap fixes. That wasn’t just good customer service, but it was real options in flight.
This also brought a new flavor to our capital allocation rhythm. Rather than annual planning cycles that locked resources into static swim lanes, we adopted gated resourcing tied to defined thresholds. Our FP&A team built simulation models in Python and R, forecasting the expected value of a resourcing move based on scenario weightings. For example, if a new vertical showed a 60% likelihood of crossing a 10-deal threshold by mid-Q3, we pre-approved GTM spend to activate contingent on hitting that signal. This looked cautious to some. But in reality, it was aggressive and in the right direction, at the right moment.
Throughout all of this, I kept returning to a central truth: uncertainty punishes rigidity, but rewards those who respect its contours. A pricing policy that cannot flex will leave margin on the table or kill deals in flight. A hiring plan that commits too early will choke working capital. And a CFO who waits for clarity before making bets will find they arrive too late. In decision theory, we often talk about “the cost of delay” versus “the cost of error.” A good options model minimizes both, which, interestingly, is not by being just right, but by being ready.
Of course, optionality without discipline can devolve into indecision. We embedded guardrails. We defined thresholds that made decision inertia unacceptable. If a cohort’s NRR dropped for three consecutive months and win-back campaigns failed, we sunsetted that motion. If a beta feature was unable to hit usage velocity within a quarter, we reallocated the development budget. These were not emotional decisions, but they were logical conclusions of failed options. And we celebrated them. A failed option, tested and closed, beats a zombie investment every time.
We also revised our communication with the board. Instead of defending fixed forecasts, we presented probability-weighted trees. “If churn holds, and expansion triggers fire, we’ll beat target by X.” “If macro shifts pull SMB renewals down by 5%, we stay within plan by flexing mid-market initiatives.” This shifted the conversation from finger-pointing to scenario readiness. Investors liked it. More importantly, so did the executive team. We could disagree on base assumptions but still align on decisions because we’d mapped the branches ahead of time.
One area where this thought made an outsized impact was compensation planning. Sales comp is notoriously fragile under volatility. We redesigned quota targets and commission accelerators using scenario bands, not fixed assumptions. We tested payout curves under best, base, and downside cases. We then ran Monte Carlo simulations to see how frequently actuals would fall into the “too much upside” or “demotivating downside” zones. This led to more durable comp plans, which meant fewer panicked mid-year resets. Our reps trusted the system. And our CFO team could model cost predictability with far greater confidence.
In retrospection, all these loops back to a single mindset shift: you don’t plan to be right. You plan to stay in the game. And staying in the game requires options that are well-designed, embedded into the process, and respected by every function. Sales needs to know they can escalate an expansion offer once particular customer signals fire. Success needs to know they have the budget authority to engage support when early churn flags arise. Product needs to know they can pause a roadmap stream if NPV no longer justifies it. And finance needs to know that its most significant power is not in control, but in preparation.
Today, when I walk into a revenue operations review or a strategic planning offsite, I do not bring a budget with fixed forecasts. I get a map. It has branches. It has signals. It has gates. And it has options, and each one designed not to predict the future, but to help us meet it with composure, and to move quickly when the fog clears.
Because in the world I have operated in, spanning economic cycles, geopolitical events, sudden buyer hesitation, system failures, and moments of exponential product success since 1994 until now, one principle has held. The companies that win are not the ones who guess right. They are the ones who remain ready. And readiness, I have learned, is the true hallmark of a great CFO.
Building a Lean Financial Infrastructure!
A lean financial infrastructure presumes the ability of every element in the value chain to preserve and generate cash flow. That is the fundamental essence of the lean infrastructure that I espouse. So what are the key elements that constitute a lean financial infrastructure?
And given the elements, what are the key tweaks that one must continually make to ensure that the infrastructure does not fall into entropy and the gains that are made fall flat or decay over time. Identification of the blocks and monitoring and making rapid changes go hand in hand.
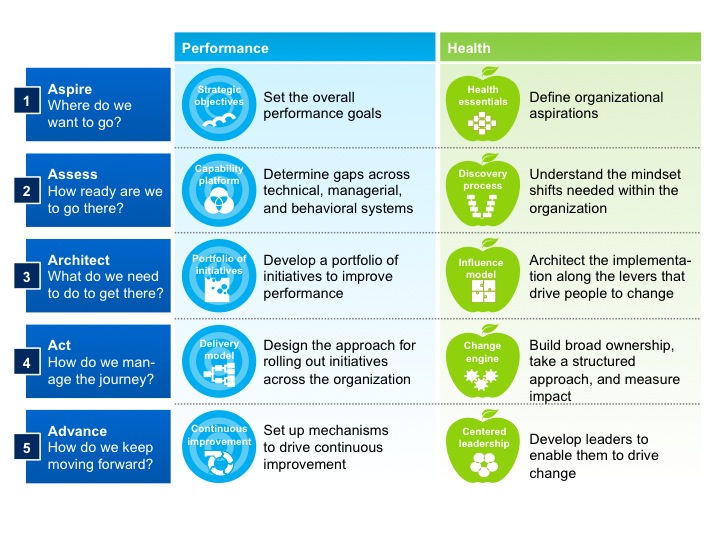
The Key Elements or the building blocks of a lean finance organization are as follows:
- Chart of Accounts: This is the critical unit that defines the starting point of the organization. It relays and groups all of the key economic activities of the organization into a larger body of elements like revenue, expenses, assets, liabilities and equity. Granularity of these activities might lead to a fairly extensive chart of account and require more work to manage and monitor these accounts, thus requiring incrementally a larger investment in terms of time and effort. However, the benefits of granularity far exceeds the costs because it forces management to look at every element of the business.
- The Operational Budget: Every year, organizations formulate the operational budget. That is generally a bottoms up rollup at a granular level that would map to the Chart of Accounts. It might follow a top-down directive around what the organization wants to land with respect to income, expense, balance sheet ratios, et al. Hence, there is almost always a process of iteration in this step to finally arrive and lock down the Budget. Be mindful though that there are feeders into the budget that might relate to customers, sales, operational metrics targets, etc. which are part of building a robust operational budget.

- The Deep Dive into Variances: As you progress through the year and part of the monthly closing process, one would inquire about how the actual performance is tracking against the budget. Since the budget has been done at a granular level and mapped exactly to the Chart of Accounts, it thus becomes easier to understand and delve into the variances. Be mindful that every element of the Chart of Account must be evaluated. The general inclination is to focus on the large items or large variances, while skipping the small expenses and smaller variances. That method, while efficient, might not be effective in the long run to build a lean finance organization. The rule, in my opinion, is that every account has to be looked and the question should be – Why? If the management has agreed on a number in the budget, then why are the actuals trending differently. Could it have been the budget and that we missed something critical in that process? Or has there been a change in the underlying economics of the business or a change in activities that might be leading to these “unexpected variances”. One has to take a scalpel to both – favorable and unfavorable variances since one can learn a lot about the underlying drivers. It might lead to managerially doing more of the better and less of the worse. Furthermore, this is also a great way to monitor leaks in the organization. Leaks are instances of cash that are dropping out of the system. Much of little leaks amounts to a lot of cash in total, in some instances. So do not disregard the leaks. Not only will that preserve the cash but once you understand the leaks better, the organization will step up in efficiency and effectiveness with respect to cash preservation and delivery of value.

- Tweak the process: You will find that as you deep dive into the variances, you might want to tweak certain processes so these variances are minimized. This would generally be true for adverse variances against the budget. Seek to understand why the variance, and then understand all of the processes that occur in the background to generate activity in the account. Once you fully understand the process, then it is a matter of tweaking this to marginally or structurally change some key areas that might favorable resonate across the financials in the future.
- The Technology Play: Finally, evaluate the possibilities of exploring technology to surface issues early, automate repetitive processes, trigger alerts early on to mitigate any issues later, and provide on-demand analytics. Use technology to relieve time and assist and enable more thinking around how to improve the internal handoffs to further economic value in the organization.
All of the above relate to managing the finance and accounting organization well within its own domain. However, there is a bigger step that comes into play once one has established the blocks and that relates to corporate strategy and linking it to the continual evolution of the financial infrastructure.
The essential question that the lean finance organization has to answer is – What can the organization do so that we address every element that preserves and enhances value to the customer, and how do we eliminate all non-value added activities? This is largely a process question but it forces one to understand the key processes and identify what percentage of each process is value added to the customer vs. non-value added. This can be represented by time or cost dimension. The goal is to yield as much value added activities as possible since the underlying presumption of such activity will lead to preservation of cash and also increase cash acquisition activities from the customer.
Convertible Debt: What, How, Plus, Minus?
Convertible Debt is also called convertible loans or convertible notes. This is a common method of financing for early stage companies. Typically, an investor or a group of investors (investor syndicate) extends a loan to a company that could later convert to an equity instrument. Like any debt, it is an interest bearing instrument. However, the key element in this form of financing is that the investors will get equity at a discount when the Company raises a Series A round. In other cases, it could be a warrant issue. In most instances, there is a cap on the valuation at which the debt will convert.

Hence, there are four key components of convertible debt:
- Convertible Debt has an interest.
- Convertible Debt has a discount
- Convertible Debt may have warrants
- Valuation at which Debt converts is capped.
Let us discuss each of these in detail.
Convertible Debt is interest bearing.
Like any debt, the borrower has a loan on their balance sheet. They are responsible for the principal and the interest. The interest is simple interest rate, and there is a fixed due date (or “maturity date”) for repayment of the amount borrowed. In other words, if there is no Series A funding before the maturity of the convertible debt, there could be some problems for the company. In an extreme case, the note holder can force the company into bankruptcy, unless the startup can renegotiate and extend the terms. The appropriate interest rate for convertible debt could be anywhere between 6% up to 10%. The Applicable Federal Rates (AFRs) can establish the lowest legally allowable interest rates.
Convertible Note Discount.
As a sweetener, the note will have an automatic conversion discount feature by which the investor will exchange the convertible debt for shares of a Series A Preferred Stock at a discount to the price per share paid by a VC in a Qualified Financing Round. Here is how this works:
A) Angel invests $100,000 in the startup company.
B) Startup issues the convertible note for $100K which has an interest and maturity date.
C) The Note has an automatic conversion feature at $1M with a conversion discount equal to 20%.
D) Now, let us say that the Startup closes $1M Series A Preferred Stock at $1 per share.
E) The Angel thus gets the shares at 80 cents.
F) So Angel gets $100,000/$0.80 per share of the Series A Preferred which totals to 125,000 shares.
Convertible Notes may have warrants.
The warrants are very similar to options. In a typical convertible note, the Warrant will be an option for whatever security is sold in the next round. It is often expressed in terms of “warrant coverage percentage”. A 20% warrant coverage means that you can take the same $1M, multiply by 20%, and the Warrant independently will enable you to get $200K of additional securities in the next round. For example, let us say a Series A round is $4M (Company has raised $4M). The warrant coverage kicks in and now the size of the round becomes $5.2M. ($4M New Fund + $1M size of Note + $200K warrant coverage = $5.2M) So there is a dilution impact of $1.2M for the $1M of angel cash that was extended in the form of the Note with the Warrant Coverage.
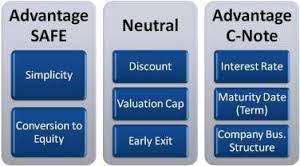
Convertible Notes Caps
Cap is a term that protects the angel investor and puts a ceiling on the conversion price of debt. This is seen mostly in seed financings. For example, angel invests a $100K in a company at 20% discount and thinks that the pre-money valuation maxes out at $3M. If the angel was correct and the valuation was indeed at $3M (assume $1.00 for preferred share) , then the angel would have 125,000 shares. That would be 125,000 shares/(3M shares + 125,000) = 4%. The investor would own 4% immediately upon Qualified Financing.
However, assume that the company is hugely successful and the pre-money valuation is assessed at $10M. Let us say that the preferred stock is at $1.00. So now you have 10M shares. Angel Investor gets 125,000 shares. Then the Investor is diluted down to 1.23%. (125K shares/ (10M shares + 125K shares)). Hence the higher the valuation in Series A, the investor gets diluted down further. Hence they use Convertible Notes Caps as a protection to their downside dilution risk. The cap sets a limit for how much the Company can raise before the investor’s shares stop getting diluted. It sets an upper limit. So if the investor in the above example sets a cap at $5M, then the discount would increase to offset the additional dilution that occurred. So in this case, the investor actually gets a 50% discount, not a 20% discount. It is important to note that the cap is structured as either or – in other words, the angel investor gets the value of the greater of the two discounts.

Advantages of Convertible Debt Financing
- Easy to raise
- Paperwork could be less than 10 pages.
- Quick turnaround time to get this signed off
- Terms are generally clearly defined
- Legal Expenses are typically less than $5000-$8000.
- Company can defer the valuation discussion until a later date
- Notes have fewer rights than Equity. Investors in Notes have less say in the direction and execution of company plans.

Disadvantages of Convertible Debt Financing
- It is a loan and there is a maturity date on the loan. If financing does not occur, the investor can recall the note and force the company into bankruptcy.
- Incentives are not necessarily aligned. Company wants more valuation in Series A but investor would want less to own larger pool. With a cap, they accomplish that but the Company owners are diluted down depending on cap or size of discount.
- Size of discount or cap could create problems for the Company seeking Series A. Series A investors might force a renegotiation thus increasing legal and other costs to the Company. A low valuation cap could adversely affect the owners of the Company.
- Conversion to equity would mean equivalent privileges with respect to rights. Bear in mind that angel investors are generally not professional VC’s and each of them have very different expertise. Equivalent rights for the different expertise may create problems and issues among all parties involved.
- Convertible Notes may have senior preferences. In the event of liquidation, the Note Holders are first in line to get their money back.
- Some angel investors may want subscription rights or super pro-rata rights to the next round of funding. This is to prevent their dilution. So they may want to have the option to participate up to a certain percentage of the next round. In other words, if the round is $5M, the subscription right might specify that the investor can participate up to 30% and that would mean that the investor has a bigger seat on the table. Such clauses may not be favorably looked at by Series A investor and these clauses could hold up financing.
Disseminating financial knowledge to develop engaged organizations
Financial awareness of key drivers are becoming the paramount leading indicators for organizational success. For most, the finance department is a corner office service that offers ad hoc analysis on strategic and operational initiatives to a company, and provides an ex-post assessment of the financial condition of the company among a select few. There are some key financial metrics that one wants to measure across all companies and all industries without exception, but then there are unique metrics that reflect the key underlying drivers for organizational success. Organizations align their forays into new markets, new strategies and new ventures around a narrative that culminates in a financial metric or a proxy that illustrates opportunities lost or gained.
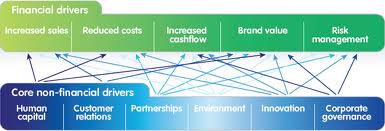
Having been cast in operational finance roles for a good length of my career, I have often encountered a high level of interest to learn financial concepts in areas such as engineering, product management, operations, sales, etc. I have to admit that I have been humbled by the fairly wide common-sense understanding of basic financial concepts that these folks have. However, in most cases, the understanding is less than skin deep with misunderstandings that are meaningful. The good news is that I have also noticed a promising trend, namely … the questions are more thoroughly weighed by the “non-finance” participants, and there seems to be an elevated understanding of key financial drivers that translate to commercial success. This knowledge continues to accelerate … largely, because of convergence of areas around data science, analytics, assessment of personal ownership stakes, etc. But the passing of such information across these channels to the hungry recipients are not formalized. In other words, I posit that having a formal channel of inculcating financial education across the various functional areas would pay rich dividends for the company in the long run. Finance is a vast enough field that partaking general knowledge in these concepts which are more than merely skin-deep would also enable the finance group to engage in meaningful conversations with other functional experts, thus allowing the narrative around the numbers to be more wholesome. Thus, imparting the financial knowledge would be beneficial to the finance department as well.

To be effective in creating a formal channel of disseminating information of the key areas in finance that matter to the organization, it is important to understand the operational drivers. When I say operational drivers, I am expanding that to encompass drivers that may uniquely affect other functional areas. For example, sales may be concerned with revenue, margins whereas production may be concerned with server capacity, work-in-process and throughput, etc. At the end, the financial metrics are derivatives. They are cross products of single or multiple drivers and these are the elements that need to be fleshed out to effect a spirited conversation. That would then enable the production of a financial barometer that everyone in the organization can rally behind and understand, and more importantly … be able to assess how their individual contribution has and will advance organization goals.
The Big Data Movement: Importance and Relevance today?
We are entering into a new age wherein we are interested in picking up a finer understanding of relationships between businesses and customers, organizations and employees, products and how they are being used, how different aspects of the business and the organizations connect to produce meaningful and actionable relevant information, etc. We are seeing a lot of data, and the old tools to manage, process and gather insights from the data like spreadsheets, SQL databases, etc., are not scalable to current needs. Thus, Big Data is becoming a framework to approach how to process, store and cope with the reams of data that is being collected.

According to IDC, it is imperative that organizations and IT leaders focus on the ever-increasing volume, variety and velocity of information that forms big data.
- Volume. Many factors contribute to the increase in data volume – transaction-based data stored through the years, text data constantly streaming in from social media, increasing amounts of sensor data being collected, etc. In the past, excessive data volume created a storage issue. But with today’s decreasing storage costs, other issues emerge, including how to determine relevance amidst the large volumes of data and how to create value from data that is relevant.
- Variety. Data today comes in all types of formats – from traditional databases to hierarchical data stores created by end users and OLAP systems, to text documents, email, meter-collected data, video, audio, stock ticker data and financial transactions. By some estimates, 80 percent of an organization’s data is not numeric! But it still must be included in analyses and decision making.
- Velocity. According to Gartner, velocity “means both how fast data is being produced and how fast the data must be processed to meet demand.” RFID tags and smart metering are driving an increasing need to deal with torrents of data in near-real time. Reacting quickly enough to deal with velocity is a challenge to most organizations.
SAS has added two additional dimensions:
- Variability. In addition to the increasing velocities and varieties of data, data flows can be highly inconsistent with periodic peaks. Is something big trending in the social media? Daily, seasonal and event-triggered peak data loads can be challenging to manage – especially with social media involved.
- Complexity. When you deal with huge volumes of data, it comes from multiple sources. It is quite an undertaking to link, match, cleanse and transform data across systems. However, it is necessary to connect and correlate relationships, hierarchies and multiple data linkages or your data can quickly spiral out of control. Data governance can help you determine how disparate data relates to common definitions and how to systematically integrate structured and unstructured data assets to produce high-quality information that is useful, appropriate and up-to-date.

So to reiterate, Big Data is a framework stemming from the realization that the data has gathered significant pace and that it’s growth has exceeded the capacity for an organization to handle, store and analyze the data in a manner that offers meaningful insights into the relationships between data points. I am calling this a framework, unlike other materials that call Big Data a consequent of the inability of organizations to handle mass amounts of data. I refer to Big Data as a framework because it sets the parameters around an organizations’ decision as to when and which tools must be deployed to address the data scalability issues.

Thus to put the appropriate parameters around when an organization must consider Big Data as part of their analytics roadmap in order to understand the patterns of data better, they have to answer the following ten questions:
- What are the different types of data that should be gathered?
- What are the mechanisms that have to be deployed to gather the relevant data?
- How should the data be processed, transformed and stored?
- How do we ensure that there is no single point of failure in data storage and data loss that may compromise data integrity?
- What are the models that have to be used to analyze the data?
- How are the findings of the data to be distributed to relevant parties?
- How do we assure the security of the data that will be distributed?
- What mechanisms do we create to implement feedback against the data to preserve data integrity?
- How do we morph the big data model into new forms that accounts for new patterns to reflect what is meaningful and actionable?
- How do we create a learning path for the big data model framework?
Some of the existing literature have commingled Big Data framework with analytics. In fact, the literature has gone on to make a rather assertive statement i.e. that Big Data and predictive analytics be looked upon in the same vein. Nothing could be further from the truth!
There are several tools available in the market to do predictive analytics against a set of data that may not qualify for the Big Data framework. While I was the CFO at Atari, we deployed business intelligence tools using Microstrategy, and Microstrategy had predictive modules. In my recent past, we had explored SAS and Minitab tools to do predictive analytics. In fact, even Excel can do multivariate, ANOVA and regressions analysis and best curve fit analysis. These analytical techniques have been part of the analytics arsenal for a long time. Different data sizes may need different tools to instantiate relevant predictive analysis. This is a very important point because companies that do not have Big Data ought to seriously reconsider their strategy of what tools and frameworks to use to gather insights. I have known companies that have gone the Big Data route, although all data points ( excuse my pun), even after incorporating capacity and forecasts, suggest that alternative tools are more cost-effective than implementing Big Data solutions. Big Data is not a one-size fit-all model. It is an expensive implementation. However, for the right data size which in this case would be very large data size, Big Data implementation would be extremely beneficial and cost effective in terms of the total cost of ownership.
Areas where Big Data Framework can be applied!
Some areas lend themselves to the application of the Big Data Framework. I have identified broadly four key areas:
- Marketing and Sales: Consumer behavior, marketing campaigns, sales pipelines, conversions, marketing funnels and drop-offs, distribution channels are all areas where Big Data can be applied to gather deeper insights.
- Human Resources: Employee engagement, employee hiring, employee retention, organization knowledge base, impact of cross-functional training, reviews, compensation plans are elements that Big Data can surface. After all, generally over 60% of company resources are invested in HR.
- Production and Operational Environments: Data growth, different types of data appended as the business learns about the consumer, concurrent usage patterns, traffic, web analytics are prime examples.
- Financial Planning and Business Operational Analytics: Predictive analytics around bottoms-up sales, marketing campaigns ROI, customer acquisitions costs, earned media and paid media, margins by SKU’s and distribution channels, operational expenses, portfolio evaluation, risk analysis, etc., are some of the examples in this category.
Hadoop: A Small Note!
Hadoop is becoming a more widely accepted tool in addressing Big Data Needs. It was invented by Google so they could index the structural and text information that they were collecting and present meaningful and actionable results to the users quickly. It was further developed by Yahoo that tweaked Hadoop for enterprise applications.
Hadoop runs on a large number of machines that don’t share memory or disks. The Hadoop software runs on each of these machines. Thus, if you have for example – over 10 gigabytes of data – you take that data and spread that across different machines. Hadoop tracks where all these data resides! The servers or machines are called nodes, and the common logical categories around which the data is disseminated are called clusters. Thus each server operates on its own little piece of the data, and then once the data is processed, the results are delivered to the main client as a unified whole. The method of reducing the disparate sources of information residing in various nodes and clusters into one unified whole is the process of MapReduce, an important mechanism of Hadoop. You will also hear something called Hive which is nothing but a data warehouse. This could be a structured or unstructured warehouse upon which the Hadoop works upon, processes data, enables redundancy across the clusters and offers a unified solution through the MapReduce function.

Personally, I have always been interested in Business Intelligence. I have always considered BI as a stepping stone, in the new age, to be a handy tool to truly understand a business and develop financial and operational models that are fairly close to the trending insights that the data generates. So my ear is always to the ground as I follow the developments in this area … and though I have not implemented a Big Data solution, I have always been and will continue to be interested in seeing its applications in certain contexts and against the various use cases in organizations.
Risk Management and Finance
If you are in finance, you are a risk manager. Say what? Risk management! Imagine being the hub in a spoke of functional areas, each of which is embedded with a risk pattern that can vary over time. A sound finance manager would be someone who would be best able to keep pulse, and be able to support the decisions that can contain the risk. Thus, value management becomes critical: Weighing the consequence of a decision against the risk that the decision poses. Not cost management, but value management. And to make value management more concrete, we turn to cash impact or rather – the discounted value of future stream of cash that may or may not be a consequent to a decision. Companies carry risks. If not, a company will not offer any premiums in value to the market. They create competitive advantage – defined as sorting a sustained growth in free cash flow as the key metric that becomes the separator.
John Kay, an eminent strategist, had identified four sources of competitive advantage: Organization Architecture and Culture, Reputation, Innovation and Strategic Assets. All of these are inextricably intertwined, and must be aligned to service value in the company. The business value approach underpins the interrelationships best. And in so doing, scenario planning emerges as a sound machination to manage risks. Understanding the profit impact of a strategy, and the capability/initiative tie-in is one of the most crucial conversations that a good finance manager could encourage in a company. Product, market and internal capabilities become the anchor points in evolving discussions. Scenario planning thus emerges in context of trends and uncertainties: a trend in patterns may open up possibilities, the latter being in the domain of uncertainty.
There are multiple methods one could use in building scenarios and engaging in fruitful risk assessment.
1.Sensitivity Assessment: Evaluate decisions in the context of the strategy’s reliance on the resilience of business conditions. Assess the various conditions in a scenario or mutually exclusive scenarios, assess a probabilistic guesstimate on success factors, and then offer simple solutions. This assessment tends to be heuristic oriented and excellent when one is dealing with few specific decisions to be made. There is an elevated sense of clarity with regard to the business conditions that may present itself. And this is most commonly used, but does not thwart the more realistic conditions where clarity is obfuscated and muddy.
2.Strategy Evaluation: Use scenarios to test a strategy by throwing a layer of interaction complexity. To the extent you can disaggregate the complexity, the evaluation of a strategy is better tenable. But once again, disaggregation has its downsides. We don’t operate in a vacuum. It is the aggregation, and negotiating through this aggregation effectively is where the real value is. You may have heard of the Mckinsey MECE (Mutually Exclusive; Comprehensively Exhaustive) methodology where strategic thrusts are disaggregated and contained within a narrow framework. The idea is that if one does that enough, one has an untrammeled confidence in choosing one initiative over another. That is true again in some cases, but my belief is that the world operates at a more synthetic level than pure analytic. We resort to analytics since it is too damned hard to synthesize, and be able to agree on an optimal solution. I am not creaming analytics; I am only suggesting that there is some possibility that a false hypothesis is accepted and a true one rejected. Thus analytics is an important tool, but must be weighed along with the synthetic tradition.
3.Synthetic Development: By far the most interesting and perhaps the most controversial with glint of academic and theoretical monstrosities included – this represents developing and broadcasting all scenarios equally weighed, and grouping interaction of scenarios. Thus, if introducing a multi-million dollar initiative in untested waters is a decision you have to weigh, one must go through the first two methods, and then review the final outcome against peripheral factors that were not introduced initially. A simple statement or realization like – The competition for Southwest is the Greyhound bus – could significantly alter the expanse of the strategy.
If you think of the new world of finance being nothing more than crunching numbers … stop and think again. Yes …crunching those numbers play a big part, less a cause than an effect of the mental model that you appropriate in this prized profession.
