Category Archives: Product Design
Model Thinking
| Model Framework |
The fundamental tenet of theory is the concept of “empiria“. Empiria refers to our observations. Based on observations, scientists and researchers posit a theory – it is part of scientific realism.
A scientific model is a causal explanation of how variables interact to produce a phenomenon, usually linearly organized. A model is a simplified map consisting of a few, primary variables that is gauged to have the most explanatory powers for the phenomenon being observed. We discussed Complex Physical Systems and Complex Adaptive Systems early on this chapter. It is relatively easier to map CPS to models than CAS, largely because models become very unwieldy as it starts to internalize more variables and if those variables have volumes of interaction between them. A simple analogy would be the use of multiple regression models: when you have a number of independent variables that interact strongly between each other, autocorrelation errors occur, and the model is not stable or does not have predictive value.

Research projects generally tend to either look at a case study or alternatively, they might describe a number of similar cases that are logically grouped together. Constructing a simple model that can be general and applied to many instances is difficult, if not impossible. Variables are subject to a researcher’s lack of understanding of the variable or the volatility of the variable. What further accentuates the problem is that the researcher misses on the interaction of how the variables play against one another and the resultant impact on the system. Thus, our understanding of our system can be done through some sort of model mechanics but, yet we share the common belief that the task of building out a model to provide all of the explanatory answers are difficult, if not impossible. Despite our understanding of our limitations of modeling, we still develop frameworks and artifact models because we sense in it a tool or set of indispensable tools to transmit the results of research to practical use cases. We boldly generalize our findings from empiria into general models that we hope will explain empiria best. And let us be mindful that it is possible – more so in the CAS systems than CPS that we might have multiple models that would fight over their explanatory powers simply because of the vagaries of uncertainty and stochastic variations.
Popper says: “Science does not rest upon rock-bottom. The bold structure of its theories rises, as it were, above a swamp. It is like a building erected on piles. The piles are driven down from above into the swamp, but not down to any natural or ‘given’ base; and when we cease our attempts to drive our piles into a deeper layer, it is not because we have reached firm ground. We simply stop when we are satisfied that they are firm enough to carry the structure, at least for the time being”. This leads to the satisficing solution: if a model can choose the least number of variables to explain the greatest amount of variations, the model is relatively better than other models that would select more variables to explain the same. In addition, there is always a cost-benefit analysis to be taken into consideration: if we add x number of variables to explain variation in the outcome but it is not meaningfully different than variables less than x, then one would want to fall back on the less-variable model because it is less costly to maintain.
Researchers must address three key elements in the model: time, variation and uncertainty. How do we craft a model which reflects the impact of time on the variables and the outcome? How to present variations in the model? Different variables might vary differently independent of one another. How do we present the deviation of the data in a parlance that allows us to make meaningful conclusions regarding the impact of the variations on the outcome? Finally, does the data that is being considered are actual or proxy data? Are the observations approximate? How do we thus draw the model to incorporate the fuzziness: would confidence intervals on the findings be good enough?
Two other equally other concepts in model design is important: Descriptive Modeling and Normative Modeling.
Descriptive models aim to explain the phenomenon. It is bounded by that goal and that goal only.
There are certain types of explanations that they fall back on: explain by looking at data from the past and attempting to draw a cause and effect relationship. If the researcher is able to draw a complete cause and effect relationship that meets the test of time and independent tests to replicate the results, then the causality turns into law for the limited use-case or the phenomenon being explained. Another explanation method is to draw upon context: explaining a phenomenon by looking at the function that the activity fulfills in its context. For example, a dog barks at a stranger to secure its territory and protect the home. The third and more interesting type of explanation is generally called intentional explanation: the variables work together to serve a specific purpose and the researcher determines that purpose and thus, reverse engineers the understanding of the phenomenon by understanding the purpose and how the variables conform to achieve that purpose.
This last element also leads us to thinking through the other method of modeling – namely, normative modeling. Normative modeling differs from descriptive modeling because the target is not to simply just gather facts to explain a phenomenon, but rather to figure out how to improve or change the phenomenon toward a desirable state. The challenge, as you might have already perceived, is that the subjective shadow looms high and long and the ultimate finding in what would be a normative model could essentially be a teleological representation or self-fulfilling prophecy of the researcher in action. While this is relatively more welcome in a descriptive world since subjectivism is diffused among a larger group that yields one solution, it is not the best in a normative world since variation of opinions that reflect biases can pose a problem.
How do we create a representative model of a phenomenon? First, we weigh if the phenomenon is to be understood as a mere explanation or to extend it to incorporate our normative spin on the phenomenon itself. It is often the case that we might have to craft different models and then weigh one against the other that best represents how the model can be explained. Some of the methods are fairly simple as in bringing diverse opinions to a table and then agreeing upon one specific model. The advantage of such an approach is that it provides a degree of objectivism in the model – at least in so far as it removes the divergent subjectivity that weaves into the various models. Other alternative is to do value analysis which is a mathematical method where the selection of the model is carried out in stages. You define the criteria of the selection and then the importance of the goal (if that be a normative model). Once all of the participants have a general agreement, then you have the makings of a model. The final method is to incorporate all all of the outliers and the data points in the phenomenon that the model seeks to explain and then offer a shared belief into those salient features in the model that would be best to apply to gain information of the phenomenon in a predictable manner.

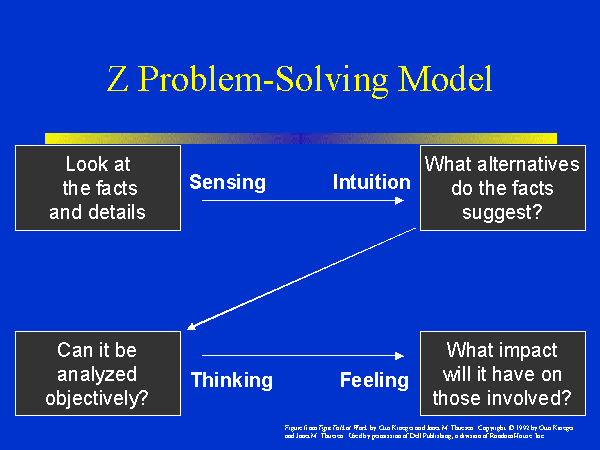
There are various languages that are used for modeling:
Written Language refers to the natural language description of the model. If price of butter goes up, the quantity demanded of the butter will go down. Written language models can be used effectively to inform all of the other types of models that follow below. It often goes by the name of “qualitative” research, although we find that a bit limiting. Just a simple statement like – This model approximately reflects the behavior of people living in a dense environment …” could qualify as a written language model that seeks to shed light on the object being studied.
Icon Models refer to a pictorial representation and probably the earliest form of model making. It seeks to only qualify those contours or shapes or colors that are most interesting and relevant to the object being studied. The idea of icon models is to pictorially abstract the main elements to provide a working understanding of the object being studied.
Topological Models refer to how the variables are placed with respect to one another and thus helps in creating a classification or taxonomy of the model. Once can have logical trees, class trees, Venn diagrams, and other imaginative pictorial representation of fields to further shed light on the object being studied. In fact, pictorial representations must abide by constant scale, direction and placements. In other words, if the variables are placed on a different scale on different maps, it would be hard to draw logical conclusions by sight alone. In addition, if the placements are at different axis in different maps or have different vectors, it is hard to make comparisons and arrive at a shared consensus and a logical end result.
Arithmetic Models are what we generally fall back on most. The data is measured with an arithmetic scale. It is done via tables, equations or flow diagrams. The nice thing about arithmetic models is that you can show multiple dimensions which is not possible with other modeling languages. Hence, the robustness and the general applicability of such models are huge and thus is widely used as a key language to modeling.
Analogous Models refer to crafting explanations using the power of analogy. For example, when we talk about waves – we could be talking of light waves, radio waves, historical waves, etc. These metaphoric representations can be used to explain phenomenon, but at best, the explanatory power is nebulous, and it would be difficult to explain the variations and uncertainties between two analogous models. However, it still is used to transmit information quickly through verbal expressions like – “Similarly”, “Equivalently”, “Looks like ..” etc. In fact, extrapolation is a widely used method in modeling and we would ascertain this as part of the analogous model to a great extent. That is because we time-box the variables in the analogous model to one instance and the extrapolated model to another instance and we tie them up with mathematical equations.
Introduce Culture into Product Development
All products go through a life-cycle. However, the genius of an organization lies in how to manage the life-cycle of the product and extend it as necessary to serve the customers. Thus, it is not merely the wizardry in technology and manufacturing that determine the ultimate longevity of the product in the market and the mind share of the customer. The product has to respond to the diversity of demands determined by disposable income, demographics, geography, etc. In business school speak, we say that this is part of market segmentation coupled with the appropriate marketing message. However, there is not an explicit strategy formulated around identifying
- Corporate Culture
- Extended Culture
To achieve success, firms increasingly must develop products by leveraging ad coordinating broad creative capabilities and resources, which often are diffused across geographical and cultural boundaries. But what we have to explore is a lot more than that from the incipient stages that a product has imagined: How do we instill unique corporate DNA into the product that immediately marks the product with a corporate signature? In addition, how do we built out a product that is tenable across the farthest reaches of geography and cultural diversity?

Thus, an innovative approach is called for in product development … particularly, in a global context. The approach entails getting cross-disciplinary teams in liberal arts, science, business, etc. to work together to gather deeper insights into the cultural strains that drive decisions in various markets. To reiterate, there is no one particular function that is paramount: all of them have to work and improvise together while ensuring that there are channels that gather feedback. The cross disciplinary team and the institutionalization of a feedback mechanism that can be quickly acted upon are the key parameters to ensure that the right product is in the market and that it will be extended accordingly to the chatter of the crowds.
Having said that, this is hardly news! A lot of companies are well on their way to instill these factors into product design and development. Companies have created organizational architectures in the corporate structure in a manner that culturally appropriate products are developed and maintained in dispersed local markets. However, in most instances, we have also seen that the way they view this is to have local managers run the show, with the presumption that these “culturally appropriate” products will make good in those markets. But along the way, the piece that dissembles over time on account of creating the local flavor is that the product may not mirror the culture that the corporate group wants to instill. If these two are not aptly managed and balanced, islands of conflict will be created. Thus, my contention is that a top-down value mandate ought to set the appropriate parameters inside which the hotbed of collaborative activity would take place for product design and development in various markets.

Thus the necessary top down value systems that would bring culture into products would be:
- Open areas for employees to express their thoughts and ideas
- Diversity of people with different skill sets in product teams will contribute to product development
- Encouraging internal and external speakers to expound upon the product touch points in the community.
- Empowerment and recognition systems.
- Proper formulation of monetary incentives to inspire and maintain focus.
Pivots – The Unholy Grail of Employee Engagement !
Most of you today have heard the word “pivot”. It has become a very ubiquitous word – it pretends to be something which it is not. And entrepreneurs and VC’s have found oodles of reasons to justify that word. Some professional CXO’s throw that word around in executive meetings, board meetings, functional meetings … somehow they feel that these are one of the few words that give them gravitas. So “pivot” has become the sexy word – it portrays that the organization and the management is flexible and will iterate around its axis quickly to accommodate new needs … in fact, they would change direction altogether for the good of the company and the customers. After all, agility is everything, isn’t it? And couple that with Lean Startup – the other Valley buzz word … and you have created a very credible persona. (I will deal with the Lean Startup in a later blog and give that its due. As a matter of fact, the concept of “pivot” was introduced by Eric Ries who has also introduced the concept of Lean Startup).

Pivots happen when the company comes out with product that is not the right fit to market. They assess that customers want something different. Tweaking the product to fit the needs of the customer does not constitute a pivot. But if you change the entire product or direction of the company – that would be considered a pivot.
Attached is an interesting link that I came across —
It gives examples of eight entrepreneurs who believe that they have exercised pivot in their business model. But if you read the case studies closely, none of them did. They tweaked and tweaked and tweaked along the way. The refined their model. Scripted.com appears to be the only example that comes closest to the concept of the “pivot” as understood in the Valley.
Some of the common pivots that have been laid out by Eric Ries and Martin Zwilling are as follows 😦http://blog.startupprofessionals.com/2012/01/smart-business-knows-8-ways-to-pivot.html). I have taken the liberty of laying all of these different pivots out that is on Mr. Zwilling’s blog.
- Customer problem pivot. In this scenario, you use essentially the same product to solve a different problem for the same customer segment. Eric says that Starbucks famously did this pivot when they went from selling coffee beans and espresso makers to brewing drinks in-house.
- Market segment pivot. This means you take your existing product and use it to solve a similar problem for a different set of customers. This may be necessary when you find that consumers aren’t buying your product, but enterprises have a similar problem, with money to spend. Sometimes this is more a marketing change than a product change.
- Technology pivot. Engineers always fight to take advantage of what they have built so far. So the most obvious pivot for them is to repurpose the technology platform, to make it solve a more pressing, more marketable, or just a more solvable problem as you learn from customers.
- Product feature pivot. Here especially, you need to pay close attention to what real customers are doing, rather than your projections of what they should do. It can mean to zoom-in and remove features for focus, or zoom-out to add features for a more holistic solution.
- Revenue model pivot. One pivot is to change your focus from a premium price, customized solution, to a low price commoditized solution. Another common variation worth considering is the move from a one-time product sale to monthly subscription or license fees. Another is the famous razor versus blade strategy.
- Sales channel pivot. Startups with complex new products always seem to start with direct sales, and building their own brand. When they find how expensive and time consuming this is, they need to use what they have learned from customers to consider a distribution channel, ecommerce, white-labeling the product, and strategic partners.
- Product versus services pivot. Sometimes products are too different or too complex to be sold effectively to the customer with the problem. Now is the time for bundling support services with the product, education offerings, or simply making your offering a service that happens to deliver a product at the core.
- Major competitor pivot. What do you do when a major new player or competitor jumps into your space? You can charge ahead blindly, or focus on one of the above pivots to build your differentiation and stay alive.
Now please re-read all of the eight different types of “pivot” carefully! And reread again. What do you see? What do you find if you reflect upon these further? None of these are pivots! None! All of the eight items fit better into Porter’s Competition Framework. You are not changing direction. You are not suddenly reimagining a new dawn. You are simply tweaking as you learn more. So the question is – Is the rose by any other name still a rose? The answer is yes! Pivot means changing direction … in fact, so dramatically that the vestiges of the early business models fade away from living memory. And there have been successful pivots in recent business history. But less so … and for those who did, you will likely have not heard of them at all. They have long been discarded in the ash heap of history.

Great companies are established by leaders that have vision. The vision is the aspirational goal of the company. The vision statement reflects the goal in a short and succinct manner. Underlying the vision, they incorporate principles, values, missions, objectives … but they also introduce a corridor of uncertainty. Why? Because the future is rarely a measure or a simple extrapolation of expressed or latent needs of customers in the past. Apple, Microsoft, Oracle, Salesforce, Facebook, Google, Genentech, Virgin Group, Amazon, Southwest Airlines etc. are examples of great companies who have held true to their vision. They have not pivoted. Why? Because the leaders (for the most part- the founders) had a very clear and aspirational vision of the future! They did not subject themselves to sudden pivots driven by the “animal spirits” of the customers. They have understood that deep waters run still, despite the ripples and turbulence on the surface. They have honed and reflected upon consumer behavior and economic trends, and have given significant thought before they pulled up the anchor. They designed and reflected upon the ultimate end before they set sail. And once at sea, and despite the calm and the turbulence, they never lost sight of the aspirational possibilities of finding new lands, new territories, and new cultures. In fact, they can be compared to the great explorers or great writers – search for a theme and embark upon the journey …within and without. They are borne upon consistency of actions toward attainment and relief of their aspirations.

Now we are looking at the millennial generation. Quick turnarounds, fast cash, prepare the company for an acquisition and a sale or what is commonly called the “flip” … everything is super-fast and we are led to believe that this is greatness. Business plans are glibly revised. This hotbed of activity and the millennial agility to pivot toward short-term goal is the new normal — pivot is the concept that one has to be ready for and adopt quickly. I could not disagree more. When I hear pivots … it tells me that the founders have not deliberated upon the long-term goals well. In fact, it tells me that their goals are not aspirational for the most part. They are what we call in microeconomic theory examples of contestable agents in the market of price-takers. They rarely, very rarely create products that endure and stand the test of time!
So now let us relate this to organizations and people. People need stability. People do not seek instability – at least I can speak for a majority of the people. An aspirational vision in a company can completely destabilize a certain market and create tectonic shifts … but people gravitate around the stability of the aspirational vision and execute accordingly. Thus, it is very important for leadership to broadcast and needle this vision into the DNA of the people that are helping the organization execute. With stability ensured, what then happens are the disruptive innovations! This may sound counter-factual! Stability and disruptive innovations! How can these even exist convivially together and be spoken in the same breath! I contend that Innovation occurs when organizations allow creativity upon bedrock of discipline and non-compromising standards. A great writer builds out the theme and let the characters jump out of the pages!

When you have mediocrity in the vision, then the employees have nothing aspirational to engage to. They are pockets sometimes rowing the boat in one direction, and at other times rowing against one another or in a completely direction. Instability is injected into the organization. But they along with their leaders live behind the veil of ignorance – they drink the Red Bull and follow the Pied Piper of Hamelin. So beware of the pivot evangelists!
Applying Gamification in the Workplace
Wikipedia defines gamification as the use of game mechanics and game design techniques in non-game contexts. It applies to non-game applications and processes, in order to encourage people to adopt them, or to influence how they are used. It makes technology use more exciting and engaging, and encourages users to engage in desired behaviors with fruitful consequences to the environment where these techniques and processes are being deployed.

Many years ago, I took a series of courses at Cal Tech in Pasadena at the School of Industrial Relations. One of the courses was applying tools to encourage teamwork and participation. Thereafter, I have attended field trips in organizations in strategic off-sites where we had to do rope walking, free fall, climbing bamboo structures strung together to retrieve flags, etc. Thus, in those days – we applied sports and board games to fuel a shared success environment. Now things have become more technology oriented, and we have thus seamlessly transitioned to some extent from those environments to consumer web based experiences. This does not suggest that the other alternatives are less rewarding; they draw upon other types of triggers but gamification through technology is more accessible and generally less expensive with less overhead in the long run.
What are the four key elements in Gamification?
Games generally tend to have four elements that are closely intertwined. Absent any of these four elements and the jury would be out on whether the application could suitably be considered gamified. Clearly, when these elements are being applied to non-gaming contexts, you will find that some of these elements are more watered down or cruder representation of game design principles or applications to actual game play environments. Regardless, all of these elements are necessary conditions that must come into play.

1.Narratives
Games have narratives. They must be able to tell a story. They must place the player or user in a context, make them aware of the context, create a temporal dimension of a past, present and future and provide a theme or a set of themes that the players pursue.
2.Game Mechanics
These constitute the provision of tools and use cases that create PvP (Player vs. Player) or PvE (Player vs. Environment) experience. Common tools like teleporting, cockpit load (number of player controls), in-game user interaction, human-computer interaction, etc. come into play. The mechanics must aptly support the narrative.
3.Aesthetics
People look for rich experiences. In MMORPG, the aesthetics are extremely rich and immersive. In gamified applications, it need not be so. Regardless, users have continued to raise the bar on aesthetics and richness of media to support their interaction. So the trend toward aesthetics will continue, albeit at a lower benchmark than would be in the extreme case of a high quality MMORPG game.
4.Rewards
Finally, games have to have a purpose. The narratives have to have a light at the end of the tunnel. There is a carrot and stick principle in game design. It is a very important component to either persuade people to behave or not behave in a certain manner. Rewards are vanity points awarded for achieving goals that are user-driven or context driven. Either way, it is and will continue to remain the key element in game design.

The myth of rewards!
In one my earlier blogs, I laid out the distinction between intrinsic and extrinsic motivation. This has bearing on the concept of rewards and recognition in the workplace. You can find the details in my blog – “Intrinsic and Extrinsic Motivation: Impact on Employee Engagement”. (https://linkedstarsblog.com/2012/10/16/intrinsic-and-extrinsic-motivation-impact-on-employee-engagement/
Designing an application with rewards to fuel engagement in the workplace is a good idea. But rewards have to follow a narrative, a storyline. For example, an application that simply awards points and badges based on transactions without a narrative cannot be considered an application that applies all of the elements of the gamification process. It only addresses one element, and in fact, for some it is the least important component. When one focuses the product design around this single component, I contend that you are not really gamifying; you are in fact drawing upon some temporary impulses that are not sustainable and enduring.
Hence, the narrative and craftsmanship is quite critical to gamifying an application and making it relevant for employees in the workplace.
One must adopt the right mix of the gaming elements to ultimately create ends such as stickiness, re-engagement, and deeper levels of interaction, fun, challenge, promoting options to cooperate and also compete, and broadcast success.

Scales:
So now we arrive at assessing the scales to benchmark each of those ends. I am being particular by not calling these tools, since tools are to support mechanics whereas scales are manifestations of an end result. For practical design and implementation purposes, here are a few scales that are common across all games, some of which are quite relevant for gamification in an employee setting. Some of the more common scales to assess or broadcast success are:
1) Leaderboards

2) Achievement levels and measures of achievements
3) Challenges between users
4) Progress Bars

5) Reward Points that have redemption value

To reiterate, for the final outcomes associated with the scales to be meaningful, the narrative is extremely important. Storyboarding the experience in various settings is the key to designing relevant gamified applications. In fact, applying the appropriate narratives concerning particular industries is a very interesting architectural initiative that can be pursued.

Thus, in the case of workplace engagement, if the nuances of the work and the industry were emulated around themes with contextual narratives, it would truly make for wonderful experiences that ignite employee engagement while furthering corporate objectives.
Viral Coefficient – Quick Study and Social Network Implications
Virality is a metric that has been borrowed from the field of epidemiology. It pertains to how quickly an element or content spreads through the population. Thus, these elements could be voluntarily or involuntarily adopted. Applying it to the world of digital content, I will restrict my scope to that of voluntary adoption by participants who have come into contact with the elements.
The two driving factors around virality relate to Viral Coefficient and Viral Cycle Time. They are mutually exclusive concepts, but once put together in a tight system within the context of product design for dissemination, it becomes a very powerful customer acquisition tool. However, this certainly does not mean that increased virality will lead to increased profits. We will touch upon this subject later on for in doing so we have to assess what profit means – in other words, the various components in the profit equation and whether virality has any consequence to the result. Introducing profit motive in a viral environment could, on the other hand, lead to counterfactual consequences and may depress the virality coefficient and entropy the network.
What is the Viral Coefficient?
You will often hear the Viral Coefficient referred to as K. For example, you start an application that you put out on the web as a private beta. You offer them the tool to invite their contacts to register for the application. For example, if you start off with 10 private beta testers, and each of them invites 10 friends and let us say 20% of the 10 friends actually convert to be a registered user. What does this mean mathematically as we step through the first cycle? Incrementally, that would mean 10*10*20% = 20 new users that will be generated by your initial ten users. So at the end of the first cycle, you would have 30 users. But bear in mind that this is the first cycle only. Now the 30 users have the Invite tool to send to 10 additional users of which 10% convert. What does that translate to? It would be 30*10*10% =30 additional people over the base of 30 of your current installed based. That means now you have a total of 60 users. So you have essentially sent out 100 invites and then another 300 invites for a total of 400 invites — you have converted 50 users out of the 400 invites which translates to a 12.5% conversion rate through the second cycle. In general, you will find that as you step through more cycles, your conversion percentage will actually decay. In the first cycle, the viral coefficient (K) = 2 (Number of Invites (10) * conversion percentage (20%)), and through the incremental second cycle (K) = 10% (Number of Invites (10) * conversion percentage (10%)), and the total viral coefficient (K) is 1. If the K < 1, the system lends itself to decay … the pace of decay being a function of how low the viral coefficient is. On the other hand if you have K>1 or 100%, then your system will grow fairly quickly. The actual growth will be based on you starting base. A large starting base with K>1 is a fairly compelling model for growth.

The Viral Cycle Time:
This is the response time of a recipient to act upon an invite and send it out to their connection. In other words, using the above example, when your 10 users send out 10 invites and they are immediately acted upon ( for modeling simplicity, immediate means getting the invite and turning it around and send additional invites immediately and so on and on), that constitutes the velocity of the viral cycle otherwise known as Viral Cycle time. The growth and adoption of your product is a function of the viral cycle time. In other words, the longer the viral cycle time, the growth is significantly lower than a shorter viral cycle time. For example if you reduce viral cycle time by ½, you may experience 100X+ growth. Thus, it is another important lever to manage the growth and adoption of the application.

So when one speaks of Virality, we have to consider the Virality Coefficient and the Viral Cycle Time. These are the key components and the drivers to these components may have dependencies, but there could be some mutually exclusive underlying value drivers. Virality hence must be built into the product. It is often common to think that marketing creates virality. I believe that marketing certainly does influence virality but it is more important, if and when possible, to design the product with the viral hooks.
