Blog Archives
Bias and Error: Human and Organizational Tradeoff
“I spent a lifetime trying to avoid my own mental biases. A.) I rub my own nose into my own mistakes. B.) I try and keep it simple and fundamental as much as I can. And, I like the engineering concept of a margin of safety. I’m a very blocking and tackling kind of thinker. I just try to avoid being stupid. I have a way of handling a lot of problems — I put them in what I call my ‘too hard pile,’ and just leave them there. I’m not trying to succeed in my ‘too hard pile.’” : Charlie Munger — 2020 CalTech Distinguished Alumni Award interview
Bias is a disproportionate weight in favor of or against an idea or thing, usually in a way that is closed-minded, prejudicial, or unfair. Biases can be innate or learned. People may develop biases for or against an individual, a group, or a belief. In science and engineering, a bias is a systematic error. Statistical bias results from an unfair sampling of a population, or from an estimation process that does not give accurate results on average.
Error refers to a outcome that is different from reality within the context of the objective function that is being pursued.
Thus, I would like to think that the Bias is a process that might lead to an Error. However, that is not always the case. There are instances where a bias might get you to an accurate or close to an accurate result. Is having a biased framework always a bad thing? That is not always the case. From an evolutionary standpoint, humans have progressed along the dimension of making rapid judgements – and much of them stemming from experience and their exposure to elements in society. Rapid judgements are typified under the System 1 judgement (Kahneman, Tversky) which allows bias and heuristic to commingle to effectively arrive at intuitive decision outcomes.

And again, the decision framework constitutes a continually active process in how humans or/and organizations execute upon their goals. It is largely an emotional response but could just as well be an automated response to a certain stimulus. However, there is a danger prevalent in System 1 thinking: it might lead one to comfortably head toward an outcome that is seemingly intuitive, but the actual result might be significantly different and that would lead to an error in the judgement. In math, you often hear the problem of induction which establishes that your understanding of a future outcome relies on the continuity of the past outcomes, and that is an errant way of thinking although it still represents a useful tool for us to advance toward solutions.
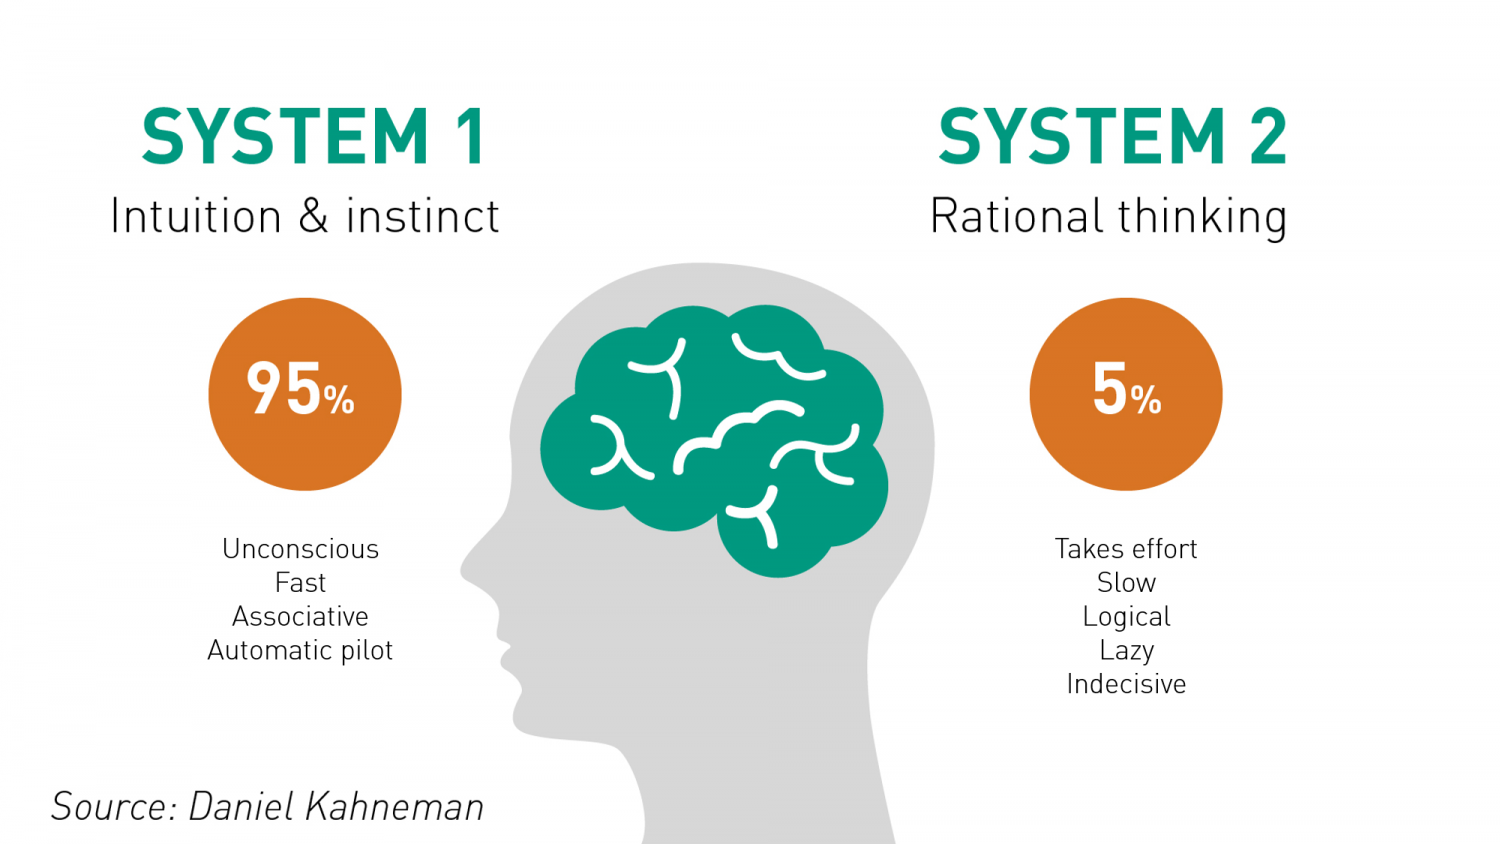
System 2 judgement emerges as another means to temper the more significant variabilities associated with System 1 thinking. System 2 thinking represents a more deliberate approach which leads to a more careful construct of rationale and thought. It is a system that slows down the decision making since it explores the logic, the assumptions, and how the framework tightly fits together to test contexts. There are a more lot more things at work wherein the person or the organization has to invest the time, focus the efforts and amplify the concentration around the problem that has to be wrestled with. This is also the process where you search for biases that might be at play and be able to minimize or remove that altogether. Thus, each of the two Systems judgement represents two different patterns of thinking: rapid, more variable and more error prone outcomes vs. slow, stable and less error prone outcomes.
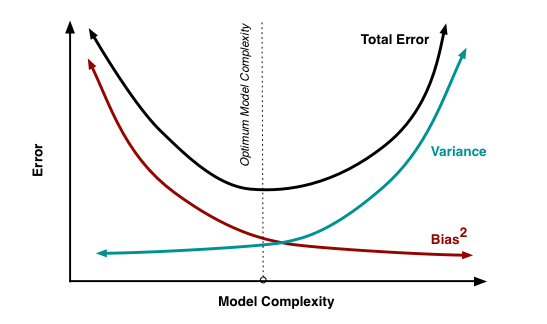
So let us revisit the Bias vs. Variance tradeoff. The idea is that the more bias you bring to address a problem, there is less variance in the aggregate. That does not mean that you are accurate. It only means that there is less variance in the set of outcomes, even if all of the outcomes are materially wrong. But it limits the variance since the bias enforces a constraint in the hypotheses space leading to a smaller and closely knit set of probabilistic outcomes. If you were to remove the constraints in the hypotheses space – namely, you remove bias in the decision framework – well, you are faced with a significant number of possibilities that would result in a larger spread of outcomes. With that said, the expected value of those outcomes might actually be closer to reality, despite the variance – than a framework decided upon by applying heuristic or operating in a bias mode.
So how do we decide then? Jeff Bezos had mentioned something that I recall: some decisions are one-way street and some are two-way. In other words, there are some decisions that cannot be undone, for good or for bad. It is a wise man who is able to anticipate that early on to decide what system one needs to pursue. An organization makes a few big and important decisions, and a lot of small decisions. Identify the big ones and spend oodles of time and encourage a diverse set of input to work through those decisions at a sufficiently high level of detail. When I personally craft rolling operating models, it serves a strategic purpose that might sit on shifting sands. That is perfectly okay! But it is critical to evaluate those big decisions since the crux of the effectiveness of the strategy and its concomitant quantitative representation rests upon those big decisions. Cutting corners can lead to disaster or an unforgiving result!
I will focus on the big whale decisions now. I will assume, for the sake of expediency, that the series of small decisions, in the aggregate or by itself, will not sufficiently be large enough that it would take us over the precipice. (It is also important however to examine the possibility that a series of small decisions can lead to a more holistic unintended emergent outcome that might have a whale effect: we come across that in complexity theory that I have already touched on in a set of previous articles).

Cognitive Biases are the biggest mea culpas that one needs to worry about. Some of the more common biases are confirmation bias, attribution bias, the halo effect, the rule of anchoring, the framing of the problem, and status quo bias. There are other cognition biases at play, but the ones listed above are common in planning and execution. It is imperative that these biases be forcibly peeled off while formulating a strategy toward problem solving.
But then there are also the statistical biases that one needs to be wary of. How we select data or selection bias plays a big role in validating information. In fact, if there are underlying statistical biases, the validity of the information is questionable. Then there are other strains of statistical biases: the forecast bias which is the natural tendency to be overtly optimistic or pessimistic without any substantive evidence to support one or the other case. Sometimes how the information is presented: visually or in tabular format – can lead to sins of the error of omission and commission leading the organization and judgement down paths that are unwarranted and just plain wrong. Thus, it is important to be aware of how statistical biases come into play to sabotage your decision framework.

One of the finest illustrations of misjudgment has been laid out by Charlie Munger. Here is the excerpt link : https://fs.blog/great-talks/psychology-human-misjudgment/ He lays out a very comprehensive 25 Biases that ail decision making. Once again, stripping biases do not necessarily result in accuracy — it increases the variability of outcomes that might be clustered around a mean that might be closer to accuracy than otherwise.
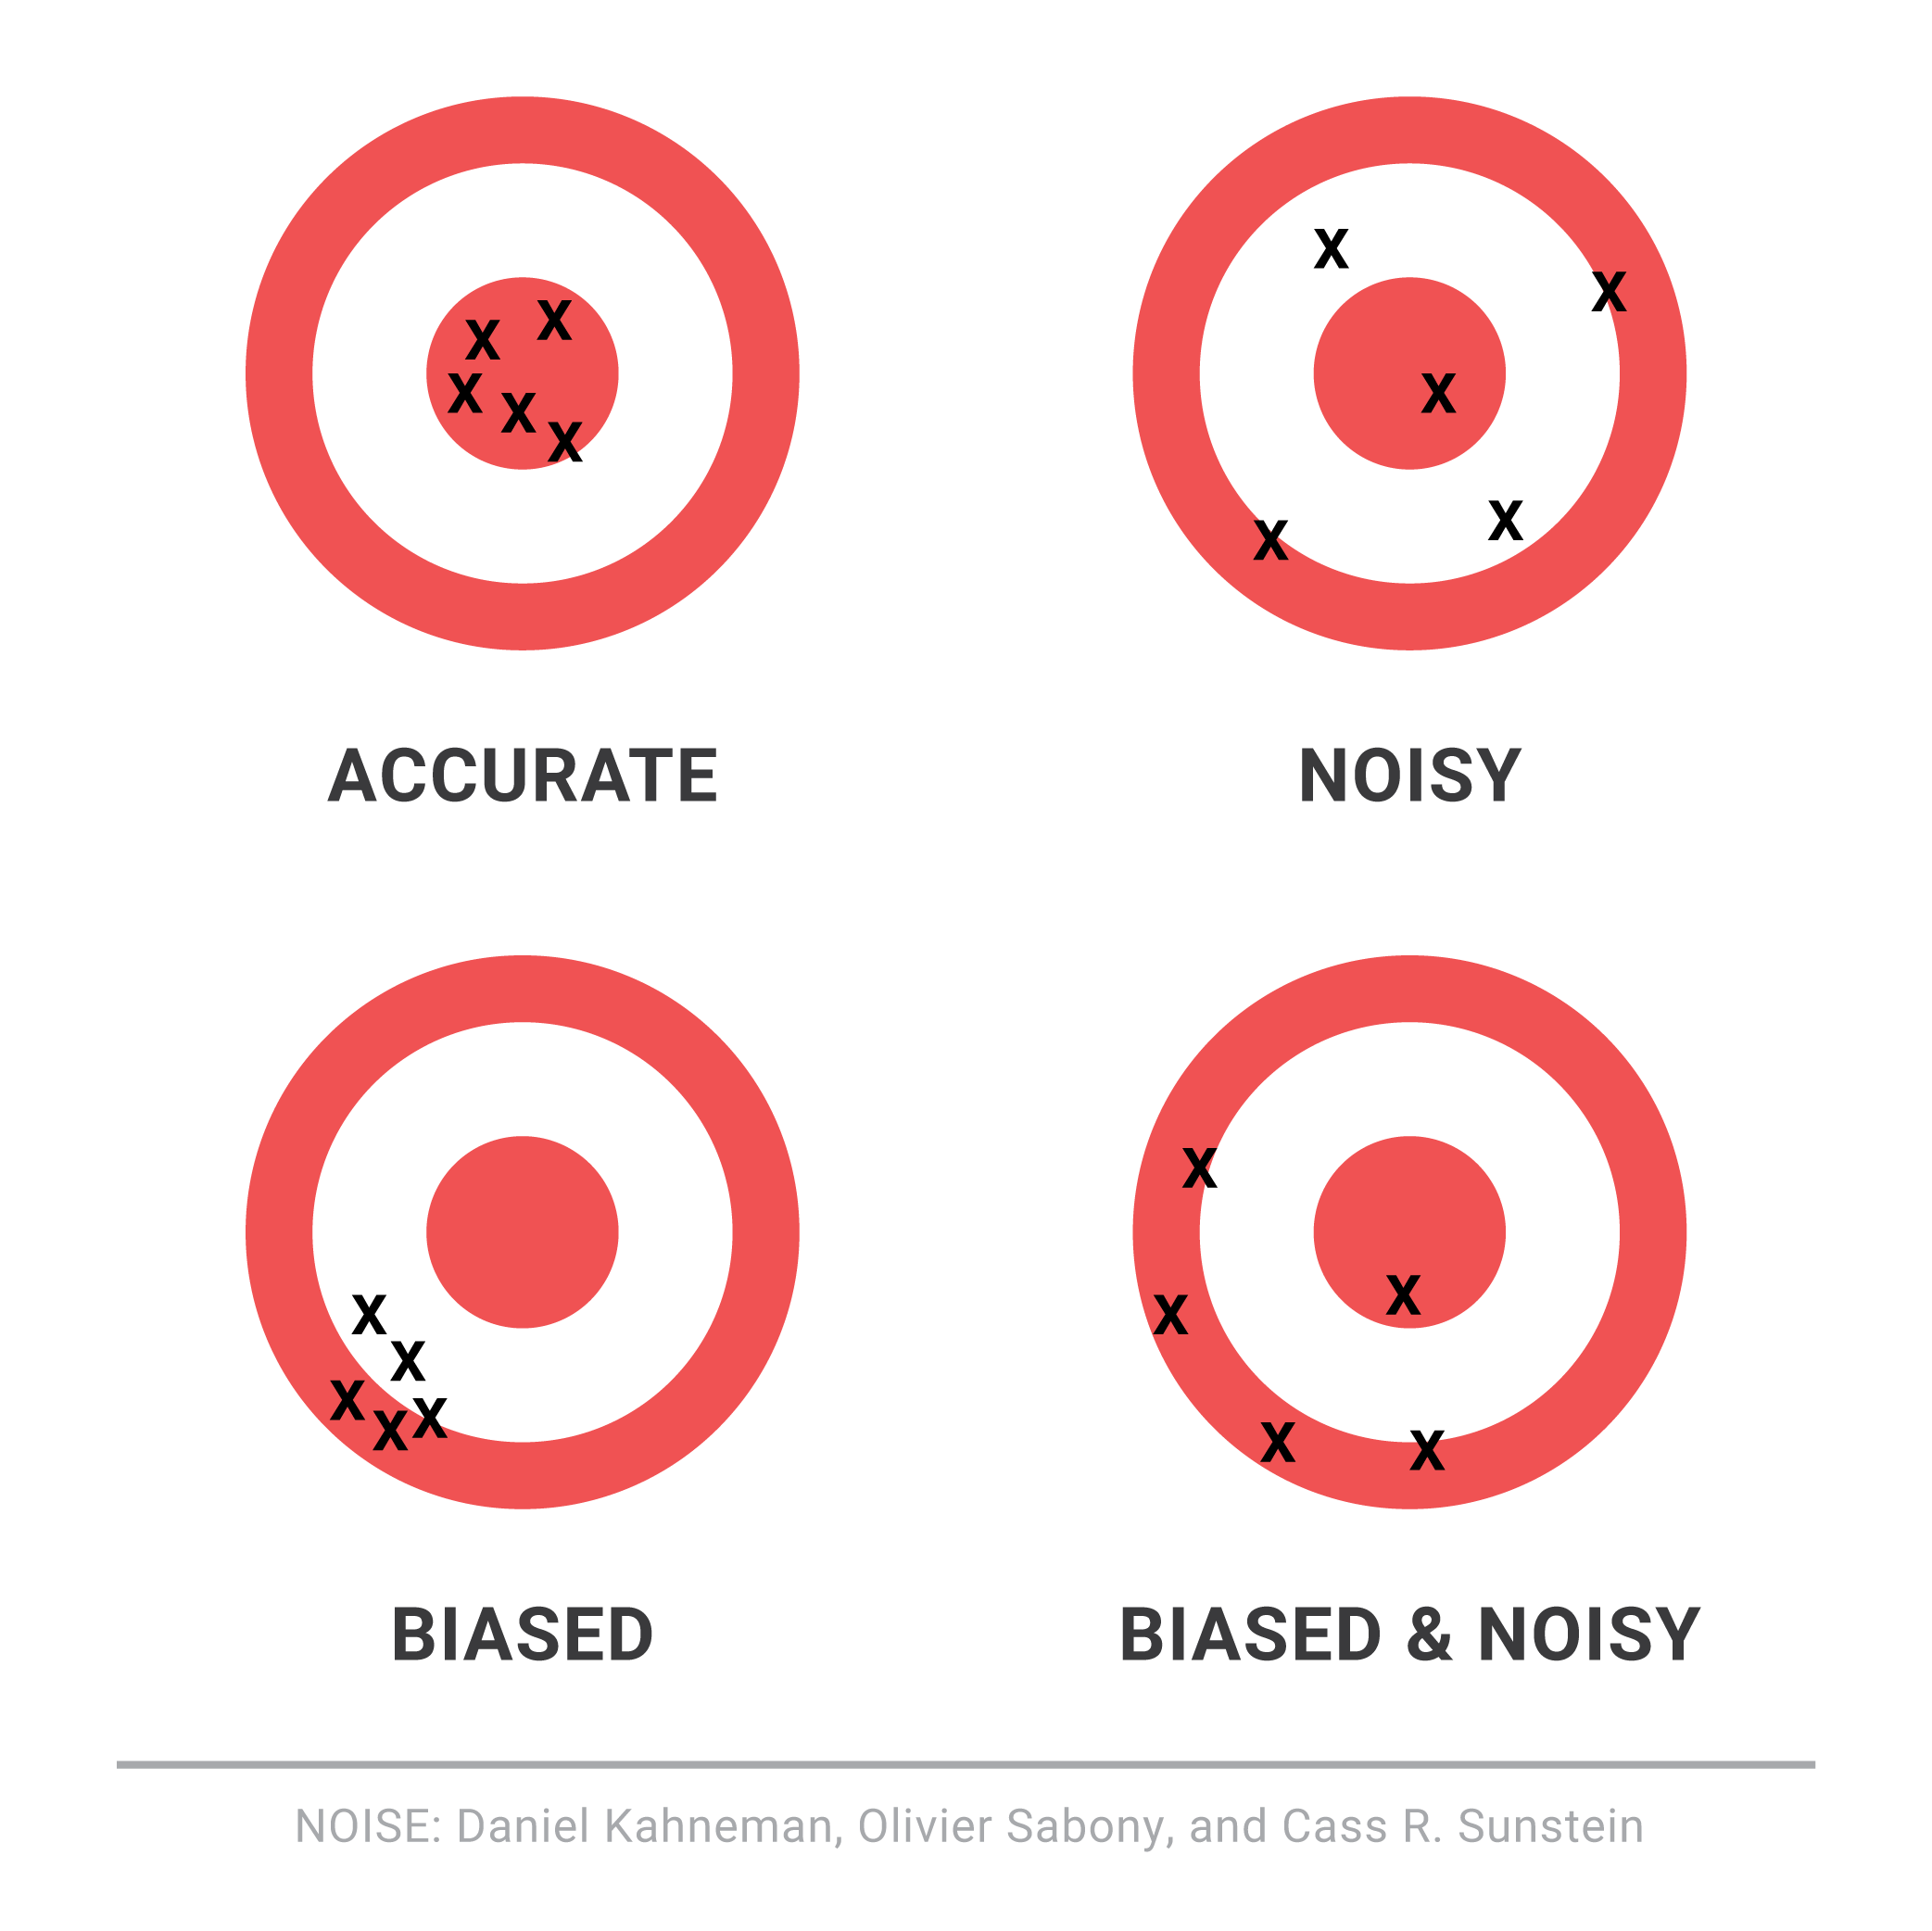
Variability is Noise. We do not know a priori what the expected mean is. We are close, but not quite. There is noise or a whole set of outcomes around the mean. Viewing things closer to the ground versus higher would still create a likelihood of accepting a false hypothesis or rejecting a true one. Noise is extremely hard to sift through, but how you can sift through the noise to arrive at those signals that are determining factors, is critical to organization success. To get to this territory, we have eliminated the cognitive and statistical biases. Now is the search for the signal. What do we do then? An increase in noise impairs accuracy. To improve accuracy, you either reduce noise or figure out those indicators that signal an accurate measure.
This is where algorithmic thinking comes into play. You start establishing well tested algorithms in specific use cases and cross-validate that across a large set of experiments or scenarios. It has been proved that algorithmic tools are, in the aggregate, superior to human judgement – since it systematically can surface causal and correlative relationships. Furthermore, special tools like principal component analysis and factory analysis can incorporate a large input variable set and establish the patterns that would be impregnable for even System 2 mindset to comprehend. This will bring decision making toward the signal variants and thus fortify decision making.
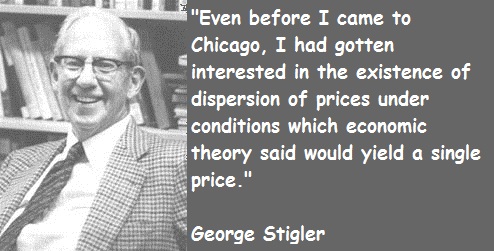
The final element is to assess the time commitment required to go through all the stages. Given infinite time and resources, there is always a high likelihood of arriving at those signals that are material for sound decision making. Alas, the reality of life does not play well to that assumption! Time and resources are constraints … so one must make do with sub-optimal decision making and establish a cutoff point wherein the benefits outweigh the risks of looking for another alternative. That comes down to the realm of judgements. While George Stigler, a Nobel Laureate in Economics, introduce search optimization in fixed sequential search – a more concrete example has been illustrated in “Algorithms to Live By” by Christian & Griffiths. They suggested an holy grail response: 37% is the accurate answer. In other words, you would reach a suboptimal decision by ensuring that you have explored up to 37% of your estimated maximum effort. While the estimated maximum effort is quite ambiguous and afflicted with all of the elements of bias (cognitive and statistical), the best thinking is to be as honest as possible to assess that effort and then draw your search threshold cutoff.
An important element of leadership is about making calls. Good calls, not necessarily the best calls! Calls weighing all possible circumstances that one can, being aware of the biases, bringing in a diverse set of knowledge and opinions, falling back upon agnostic tools in statistics, and knowing when it is appropriate to have learnt enough to pull the trigger. And it is important to cascade the principles of decision making and the underlying complexity into and across the organization.
Building a Lean Financial Infrastructure!
A lean financial infrastructure presumes the ability of every element in the value chain to preserve and generate cash flow. That is the fundamental essence of the lean infrastructure that I espouse. So what are the key elements that constitute a lean financial infrastructure?
And given the elements, what are the key tweaks that one must continually make to ensure that the infrastructure does not fall into entropy and the gains that are made fall flat or decay over time. Identification of the blocks and monitoring and making rapid changes go hand in hand.
The Key Elements or the building blocks of a lean finance organization are as follows:
- Chart of Accounts: This is the critical unit that defines the starting point of the organization. It relays and groups all of the key economic activities of the organization into a larger body of elements like revenue, expenses, assets, liabilities and equity. Granularity of these activities might lead to a fairly extensive chart of account and require more work to manage and monitor these accounts, thus requiring incrementally a larger investment in terms of time and effort. However, the benefits of granularity far exceeds the costs because it forces management to look at every element of the business.
- The Operational Budget: Every year, organizations formulate the operational budget. That is generally a bottoms up rollup at a granular level that would map to the Chart of Accounts. It might follow a top-down directive around what the organization wants to land with respect to income, expense, balance sheet ratios, et al. Hence, there is almost always a process of iteration in this step to finally arrive and lock down the Budget. Be mindful though that there are feeders into the budget that might relate to customers, sales, operational metrics targets, etc. which are part of building a robust operational budget.

- The Deep Dive into Variances: As you progress through the year and part of the monthly closing process, one would inquire about how the actual performance is tracking against the budget. Since the budget has been done at a granular level and mapped exactly to the Chart of Accounts, it thus becomes easier to understand and delve into the variances. Be mindful that every element of the Chart of Account must be evaluated. The general inclination is to focus on the large items or large variances, while skipping the small expenses and smaller variances. That method, while efficient, might not be effective in the long run to build a lean finance organization. The rule, in my opinion, is that every account has to be looked and the question should be – Why? If the management has agreed on a number in the budget, then why are the actuals trending differently. Could it have been the budget and that we missed something critical in that process? Or has there been a change in the underlying economics of the business or a change in activities that might be leading to these “unexpected variances”. One has to take a scalpel to both – favorable and unfavorable variances since one can learn a lot about the underlying drivers. It might lead to managerially doing more of the better and less of the worse. Furthermore, this is also a great way to monitor leaks in the organization. Leaks are instances of cash that are dropping out of the system. Much of little leaks amounts to a lot of cash in total, in some instances. So do not disregard the leaks. Not only will that preserve the cash but once you understand the leaks better, the organization will step up in efficiency and effectiveness with respect to cash preservation and delivery of value.

- Tweak the process: You will find that as you deep dive into the variances, you might want to tweak certain processes so these variances are minimized. This would generally be true for adverse variances against the budget. Seek to understand why the variance, and then understand all of the processes that occur in the background to generate activity in the account. Once you fully understand the process, then it is a matter of tweaking this to marginally or structurally change some key areas that might favorable resonate across the financials in the future.
- The Technology Play: Finally, evaluate the possibilities of exploring technology to surface issues early, automate repetitive processes, trigger alerts early on to mitigate any issues later, and provide on-demand analytics. Use technology to relieve time and assist and enable more thinking around how to improve the internal handoffs to further economic value in the organization.
All of the above relate to managing the finance and accounting organization well within its own domain. However, there is a bigger step that comes into play once one has established the blocks and that relates to corporate strategy and linking it to the continual evolution of the financial infrastructure.
The essential question that the lean finance organization has to answer is – What can the organization do so that we address every element that preserves and enhances value to the customer, and how do we eliminate all non-value added activities? This is largely a process question but it forces one to understand the key processes and identify what percentage of each process is value added to the customer vs. non-value added. This can be represented by time or cost dimension. The goal is to yield as much value added activities as possible since the underlying presumption of such activity will lead to preservation of cash and also increase cash acquisition activities from the customer.
Transparency in organizations
“We chose steel and extra wide panels of glass, which is almost like crystal. These are honest materials that create the right sense of strength and clarity between old and new, as well as a sense of transparency in the center of the institution that opens the campus up to the street.”

What is Transparency in the context of the organization?
It is the deliberate attempt by management to architect an organization that encourages open access to information, participation, and decision making, which ultimately creates a higher level of trust among the stakeholders.
The demand for transparency is becoming quite common. The users of goods and services are provoking the transparency question:
- Shareholder demand for increased financial accountability in the corporate world,
- Increased media diligence
- Increased regulatory diligence and requirements
- Increased demand by social interest and environmental groups
- Demands to see and check on compliance based on internal and external policies
- Increased employees’ interest in understanding how senior management decisions impact them, the organization and society
There are 2 big categories that organizations must consider and subsequently address while establishing systems in place to promote transparency.
- External Transparency
- Internal Transparency

External Transparency:
Some of the key elements are that organizations have to make the information accessible while also taking into account the risk of divulging too much information, make the information actionable, enable sharing and collaboration, managing risks, and establishing protocols and channels of communication that is open and democratic.
For example, it is important that employees ought to able to trace the integrity, quality, consistency and validity of the information back to the creator. In an open environment, it also unravels the landscape of risks that an organization maybe deliberately taking or may be carrying unknowingly. It bubbles up inappropriate decisions that can be dwelt on collectively by the management and the employees, and thus risks and inappropriateness are considerably mitigated. The other benefit obviously is that it enables too much overlap wherein people spread across the organizations may be doing the same thing in a similar manner. It affords better shared services platform and also encourages knowledge base and domain expertise that employees can tap into.
Internal Transparency:
Organization has to create the structure to encourage people to be transparent. Generally, people come to work with a mask on. What does that mean? Generally, the employees focus on the job at hand but they may be interested to add value in other ways besides their primary responsibility. In fact, they may want to approach their primary responsibility in an ingenious manner that would help the organization. But the mask or the veil that they don separates their personal interest and passions with the obligations that the job demands. Now how cool would it be if the organization sets up a remarkably safe system wherein the distinction between the employees’ personal interest and the primary obligations of the employee materially dissolve? What I bet you would discover would be higher levels of employee engagement. In addressing internal transparency, what the organization would have done is to have successfully mined and surfaced the personal interests of an employee and laid it out among all participants in a manner that would benefit the organization and the employee and their peers.
Thus, it is important to address both – internal and external transparency. However, implementing transparency ethos is not immune to challenges wherein increased transparency may distort intent, slow processes, increase organizational vulnerabilities, create psychological dissonance among employees or groups, create new factions and sometimes even result in poor decisions. Despite the challenges, the aggregate benefit of increased transparency over time would outweigh the costs. At the end, if the organization continues to formalize transparency, it would also simultaneously create and encourage trust and proper norms and mores that would lay the groundwork for an effective workforce.
Reputation is often an organization’s most valuable asset. It is built over time through a focused commitment and response to members’ wants, needs, and expectations. A commitment to transparency will increasingly become a litmus test used to define an association’s reputation and will be used as a value judgment for participation. By gaining a reputation for value through the disclosure of information, extensive communications with stakeholders, and a solid track record of truth and high disclosure of information, associations will win the respect and involvement of current and future members.
Kanter and Fine use a great analogy of transparency like an ocean sponge. These pore bearing organisms let up to twenty thousand times their volume in water pass through them every day. These sponges can withstand open, constant flow without inhibiting it because they are anchored to the ocean floor. Transparent organizations behave like these sponges: anchored to their mission and still allowing people in and out easily. Transparent organizations actually benefit from the constant flow of people and information.
Plans to implement transparency
Businesses are fighting for trust from their intended audiences. Shel Holtz and John Havens, authors of “Tactical Transparency,” state that the realities associated with doing business in today’s “business environment have emerged as the result of recent trends: Declining trust in business as usual and the increased public scrutiny under which companies find themselves thanks to the evolution of social media.” It is important, now more than ever, for organizations to use tools successfully to be sincerely but prudently transparent in ways that matter to their stakeholders.

“Tactical Transparency” adopted the following definition for transparency:
Transparency is the degree to which an organization shares the following with its stakeholder publics:
▪ Its leaders: The leaders of transparent companies are accessible and are straightforward when talking with members of key audiences.
▪ Its employees: Employees or transparent companies are accessible, can reinforce the public view of the company, and able to help people where appropriate.
▪ Its values: Ethical behavior, fair treatment, and other values are on full display in transparent companies.
▪ Its culture: How a company does things is more important today than what it does. The way things are done is not a secret in transparent companies.
▪ The results of its business practices, both good and bad: Successes, failures, problems, and victories all are communicated by transparent companies.
▪ Its business strategy: Of particular importance to the investment community but also of interest to several other audiences, a company’s strategy is a key basis for investment decisions. Misalignment of a company’s strategy and investors’ expectations usually result in disaster.
Here are some great links around transparency.
http://www.socialmediaexplorer.com/social-media-marketing/what-happens-when-transparency-goes-wrong/
According to J.D. Lasica, cofounder of Ourmedia.org and the Social Media Group, there are three levels of transparency that an organization should consider when trying to achieve tactical transparency.
▪ Operational Transparency: That involves creating or following an ethics code, conflict-of-interest policies, and any other guidelines your organization creates.
▪ Transactional Transparency: This type of strategy provides guidelines and boundaries for employees so they can participate in the conversation in and out of the office. Can they have a personal blog that discusses work-related issues?
▪ Lifestyle Transparency: This is personalized information coming from sites like Facebook and Twitter. These channels require constant transparency and authenticity.
Create an Action Plan around policies and circumstances to promote transparency:
Holtz and Havens outline specific situations where tactical transparency can transform a business, some of which are outlined in this list.
▪ Major Crises
▪ Major change initiatives
▪ Product changes
▪ New regulations that will impact business
▪ Financial matters
▪ Media interaction
▪ Employee interaction with the outside world
▪ Corporate Governance
▪ Whistleblower programs
▪ Monitoring corporate reputation internally and externally
▪ Whistleblower programs
▪ Accessibility of management

The Big Data Movement: Importance and Relevance today?
We are entering into a new age wherein we are interested in picking up a finer understanding of relationships between businesses and customers, organizations and employees, products and how they are being used, how different aspects of the business and the organizations connect to produce meaningful and actionable relevant information, etc. We are seeing a lot of data, and the old tools to manage, process and gather insights from the data like spreadsheets, SQL databases, etc., are not scalable to current needs. Thus, Big Data is becoming a framework to approach how to process, store and cope with the reams of data that is being collected.

According to IDC, it is imperative that organizations and IT leaders focus on the ever-increasing volume, variety and velocity of information that forms big data.
- Volume. Many factors contribute to the increase in data volume – transaction-based data stored through the years, text data constantly streaming in from social media, increasing amounts of sensor data being collected, etc. In the past, excessive data volume created a storage issue. But with today’s decreasing storage costs, other issues emerge, including how to determine relevance amidst the large volumes of data and how to create value from data that is relevant.
- Variety. Data today comes in all types of formats – from traditional databases to hierarchical data stores created by end users and OLAP systems, to text documents, email, meter-collected data, video, audio, stock ticker data and financial transactions. By some estimates, 80 percent of an organization’s data is not numeric! But it still must be included in analyses and decision making.
- Velocity. According to Gartner, velocity “means both how fast data is being produced and how fast the data must be processed to meet demand.” RFID tags and smart metering are driving an increasing need to deal with torrents of data in near-real time. Reacting quickly enough to deal with velocity is a challenge to most organizations.
SAS has added two additional dimensions:
- Variability. In addition to the increasing velocities and varieties of data, data flows can be highly inconsistent with periodic peaks. Is something big trending in the social media? Daily, seasonal and event-triggered peak data loads can be challenging to manage – especially with social media involved.
- Complexity. When you deal with huge volumes of data, it comes from multiple sources. It is quite an undertaking to link, match, cleanse and transform data across systems. However, it is necessary to connect and correlate relationships, hierarchies and multiple data linkages or your data can quickly spiral out of control. Data governance can help you determine how disparate data relates to common definitions and how to systematically integrate structured and unstructured data assets to produce high-quality information that is useful, appropriate and up-to-date.

So to reiterate, Big Data is a framework stemming from the realization that the data has gathered significant pace and that it’s growth has exceeded the capacity for an organization to handle, store and analyze the data in a manner that offers meaningful insights into the relationships between data points. I am calling this a framework, unlike other materials that call Big Data a consequent of the inability of organizations to handle mass amounts of data. I refer to Big Data as a framework because it sets the parameters around an organizations’ decision as to when and which tools must be deployed to address the data scalability issues.

Thus to put the appropriate parameters around when an organization must consider Big Data as part of their analytics roadmap in order to understand the patterns of data better, they have to answer the following ten questions:
- What are the different types of data that should be gathered?
- What are the mechanisms that have to be deployed to gather the relevant data?
- How should the data be processed, transformed and stored?
- How do we ensure that there is no single point of failure in data storage and data loss that may compromise data integrity?
- What are the models that have to be used to analyze the data?
- How are the findings of the data to be distributed to relevant parties?
- How do we assure the security of the data that will be distributed?
- What mechanisms do we create to implement feedback against the data to preserve data integrity?
- How do we morph the big data model into new forms that accounts for new patterns to reflect what is meaningful and actionable?
- How do we create a learning path for the big data model framework?
Some of the existing literature have commingled Big Data framework with analytics. In fact, the literature has gone on to make a rather assertive statement i.e. that Big Data and predictive analytics be looked upon in the same vein. Nothing could be further from the truth!
There are several tools available in the market to do predictive analytics against a set of data that may not qualify for the Big Data framework. While I was the CFO at Atari, we deployed business intelligence tools using Microstrategy, and Microstrategy had predictive modules. In my recent past, we had explored SAS and Minitab tools to do predictive analytics. In fact, even Excel can do multivariate, ANOVA and regressions analysis and best curve fit analysis. These analytical techniques have been part of the analytics arsenal for a long time. Different data sizes may need different tools to instantiate relevant predictive analysis. This is a very important point because companies that do not have Big Data ought to seriously reconsider their strategy of what tools and frameworks to use to gather insights. I have known companies that have gone the Big Data route, although all data points ( excuse my pun), even after incorporating capacity and forecasts, suggest that alternative tools are more cost-effective than implementing Big Data solutions. Big Data is not a one-size fit-all model. It is an expensive implementation. However, for the right data size which in this case would be very large data size, Big Data implementation would be extremely beneficial and cost effective in terms of the total cost of ownership.
Areas where Big Data Framework can be applied!
Some areas lend themselves to the application of the Big Data Framework. I have identified broadly four key areas:
- Marketing and Sales: Consumer behavior, marketing campaigns, sales pipelines, conversions, marketing funnels and drop-offs, distribution channels are all areas where Big Data can be applied to gather deeper insights.
- Human Resources: Employee engagement, employee hiring, employee retention, organization knowledge base, impact of cross-functional training, reviews, compensation plans are elements that Big Data can surface. After all, generally over 60% of company resources are invested in HR.
- Production and Operational Environments: Data growth, different types of data appended as the business learns about the consumer, concurrent usage patterns, traffic, web analytics are prime examples.
- Financial Planning and Business Operational Analytics: Predictive analytics around bottoms-up sales, marketing campaigns ROI, customer acquisitions costs, earned media and paid media, margins by SKU’s and distribution channels, operational expenses, portfolio evaluation, risk analysis, etc., are some of the examples in this category.
Hadoop: A Small Note!
Hadoop is becoming a more widely accepted tool in addressing Big Data Needs. It was invented by Google so they could index the structural and text information that they were collecting and present meaningful and actionable results to the users quickly. It was further developed by Yahoo that tweaked Hadoop for enterprise applications.
Hadoop runs on a large number of machines that don’t share memory or disks. The Hadoop software runs on each of these machines. Thus, if you have for example – over 10 gigabytes of data – you take that data and spread that across different machines. Hadoop tracks where all these data resides! The servers or machines are called nodes, and the common logical categories around which the data is disseminated are called clusters. Thus each server operates on its own little piece of the data, and then once the data is processed, the results are delivered to the main client as a unified whole. The method of reducing the disparate sources of information residing in various nodes and clusters into one unified whole is the process of MapReduce, an important mechanism of Hadoop. You will also hear something called Hive which is nothing but a data warehouse. This could be a structured or unstructured warehouse upon which the Hadoop works upon, processes data, enables redundancy across the clusters and offers a unified solution through the MapReduce function.

Personally, I have always been interested in Business Intelligence. I have always considered BI as a stepping stone, in the new age, to be a handy tool to truly understand a business and develop financial and operational models that are fairly close to the trending insights that the data generates. So my ear is always to the ground as I follow the developments in this area … and though I have not implemented a Big Data solution, I have always been and will continue to be interested in seeing its applications in certain contexts and against the various use cases in organizations.
Implementing Balanced Scorecard Model for Employee Engagement
The Balanced Scorecard Model (BSC) was introduced by Kaplan & Norton in their book “The Balanced Scorecard” (1996). It is one of the more widely used management tools in large organizations.

One of the major strengths of the BSC model is how the key categories in the BSC model links to corporate missions and objectives. The key categories which are referred to as “perspectives” illustrated in the BSC model are:
Financial Perspective:
Kaplan and Norton do not disregard the traditional need for financial data. Timely and accurate data will always be a priority, and managers will do whatever necessary to provide it. In fact, often there is more than enough handling and processing of financial data. With the implementation of a corporate database, it is hoped that more of the processing can be centralized and automated. But the point is that the current emphasis on financials leads to the “unbalanced” situation with regard to other perspectives. There is perhaps a need to include additional financial-related data, such as risk assessment and cost-benefit data, in this category.
Customer Perspective
Recent management philosophy has shown an increasing realization of the importance of customer focus and customer satisfaction in any business. These are leading indicators: if customers are not satisfied, they will eventually find other suppliers that will meet their needs. Poor performance from this perspective is thus a leading indicator of future decline, even though the current financial picture may look good. In developing metrics for satisfaction, customers should be analyzed in terms of kinds of customers and the kinds of processes for which we are providing a product or service to those customer groups
Internal Business Process Perspective
This perspective refers to internal business processes. Metrics based on this perspective allow the managers to know how well their business is running, and whether its products and services conform to customer requirements (the mission). These metrics have to be carefully designed by those who know these processes most intimately; with our unique missions these are not necessarily something that can be developed by outside consultants. My personal opinion on this matter is that the internal business process perspective is too important and that internal owners or/and teams take ownership of understanding the process.
Learning and Growth Perspective
This perspective includes employee training and corporate cultural attitudes related to both individual and corporate self-improvement. In a knowledge-worker organization, people — the only repository of knowledge — are the main resource. In the current climate of rapid technological change, it is becoming necessary for knowledge workers to be in a continuous learning mode. Metrics can be put into place to guide managers in focusing training funds where they can help the most. In any case, learning and growth constitute the essential foundation for success of any knowledge-worker organization.
Kaplan and Norton emphasize that ‘learning’ is more than ‘training’; it also includes things like mentors and tutors within the organization, as well as that ease of communication among workers, the engagement of the workers, the potential of cross-training that would create pockets of bench strength and switch hitters, and other employee specific programs that allows them to readily get help on a problem when it is needed. It also includes technological tools; what the Baldrige criteria call “high performance work systems.”
Innovation Perspective
This perspective was appended to the above four by Bain and Company. It refers to the vitality of the organization and its culture to provide the appropriate framework to encourage innovation. Organizations have to innovate. Innovation is becoming the key distinctive element in great organizations, and high levels of innovation or innovative thinking are talent magnets.
Taking the perspectives a step further, Kaplan and Cooper instituted measures and targets associated with each of those targets. The measures are geared around what the objective is associated with each of the perspectives rather than a singular granule item. Thus, if the objective is to increase customer retention, an appropriate metric or set of metrics is around how to measure the objective and track success to it than defining a customer.
One of the underlying presumptions in this model is to ensure that the key elements around which objectives are defined are done so at a fairly detailed level and to the extent possible – defined so much so that an item does not have polymorphous connotations. In other words, there is and can be only a single source of truth associated with the key element. That preserves the integrity of the model prior to its application that would lead to the element branching out into a plethora of objectives associated with the element.
Objectives, Measures, Targets and Initiatives
Within each of the Balance Scorecard financial, customer, internal process, learning perspectives and innovation perspectives, the firm must define the following:
Strategic Objectives – what the strategy is to achieve in that perspective
Measures – how progress for that particular objective will be measured
Targets – the target value sought for each measure
Initiatives – what will be done to facilitate the reaching of the target?

As in models and analytics, the information that the model spouts could be rife with a cascade of metrics. Metrics are important but too many metrics associated with the perspectives may diffuse the ultimate end that the perspectives represent.
Hence, one has to exercise restraint and rigor in defining a few key metrics that are most relevant and roll up to corporate objectives. As an example, outlined below are examples of metrics associated with the perspectives:
Financial performance (revenues, earnings, return on capital, cash flow);
Customer value performance (market share, customer satisfaction measures, customer loyalty);
Internal business process performance (productivity rates, quality measures, timeliness);
Employee performance (morale, knowledge, turnover, use of best demonstrated practices);
Innovation performance (percent of revenue from new products, employee suggestions, rate of improvement index);

To construct and implement a Balanced Scorecard, managers should:
- Articulate the business’s vision and strategy;
- Identify the performance categories that best link the business’s vision and strategy to its results (e.g., financial performance, operations, innovation, and employee performance);
- Establish objectives that support the business’s vision and strategy;
- Develop effective measures and meaningful standards, establishing both short-term milestones and long-term targets;
- Ensure company wide acceptance of the measures;
- Create appropriate budgeting, tracking, communication, and reward systems;
- Collect and analyze performance data and compare actual results with desired performance;
- Take action to close unfavorable gaps.
The link above contains a number of templates and examples that you may find helpful.

I have discussed organization architecture and employee engagement in our previous blogs. The BSC is a tool to encourage engagement while ensuring a tight architecture to further organizational goals. You may forget that as an employee, you occupy an important place in the ecosystem; the forgetting does not speak to your disenchantment toward the job, neither to your disinclination toward the uber-goals of the organization. The forgetting really speaks to potentially a lack of credible leadership that has not taken the appropriate efforts to engage the organization by pushing this structure that forces transparency. The BSC is one such articulate model that could be used, even at its crudest form factor, to get employees informed and engaged.
Risk Management and Finance
If you are in finance, you are a risk manager. Say what? Risk management! Imagine being the hub in a spoke of functional areas, each of which is embedded with a risk pattern that can vary over time. A sound finance manager would be someone who would be best able to keep pulse, and be able to support the decisions that can contain the risk. Thus, value management becomes critical: Weighing the consequence of a decision against the risk that the decision poses. Not cost management, but value management. And to make value management more concrete, we turn to cash impact or rather – the discounted value of future stream of cash that may or may not be a consequent to a decision. Companies carry risks. If not, a company will not offer any premiums in value to the market. They create competitive advantage – defined as sorting a sustained growth in free cash flow as the key metric that becomes the separator.
John Kay, an eminent strategist, had identified four sources of competitive advantage: Organization Architecture and Culture, Reputation, Innovation and Strategic Assets. All of these are inextricably intertwined, and must be aligned to service value in the company. The business value approach underpins the interrelationships best. And in so doing, scenario planning emerges as a sound machination to manage risks. Understanding the profit impact of a strategy, and the capability/initiative tie-in is one of the most crucial conversations that a good finance manager could encourage in a company. Product, market and internal capabilities become the anchor points in evolving discussions. Scenario planning thus emerges in context of trends and uncertainties: a trend in patterns may open up possibilities, the latter being in the domain of uncertainty.
There are multiple methods one could use in building scenarios and engaging in fruitful risk assessment.
1.Sensitivity Assessment: Evaluate decisions in the context of the strategy’s reliance on the resilience of business conditions. Assess the various conditions in a scenario or mutually exclusive scenarios, assess a probabilistic guesstimate on success factors, and then offer simple solutions. This assessment tends to be heuristic oriented and excellent when one is dealing with few specific decisions to be made. There is an elevated sense of clarity with regard to the business conditions that may present itself. And this is most commonly used, but does not thwart the more realistic conditions where clarity is obfuscated and muddy.
2.Strategy Evaluation: Use scenarios to test a strategy by throwing a layer of interaction complexity. To the extent you can disaggregate the complexity, the evaluation of a strategy is better tenable. But once again, disaggregation has its downsides. We don’t operate in a vacuum. It is the aggregation, and negotiating through this aggregation effectively is where the real value is. You may have heard of the Mckinsey MECE (Mutually Exclusive; Comprehensively Exhaustive) methodology where strategic thrusts are disaggregated and contained within a narrow framework. The idea is that if one does that enough, one has an untrammeled confidence in choosing one initiative over another. That is true again in some cases, but my belief is that the world operates at a more synthetic level than pure analytic. We resort to analytics since it is too damned hard to synthesize, and be able to agree on an optimal solution. I am not creaming analytics; I am only suggesting that there is some possibility that a false hypothesis is accepted and a true one rejected. Thus analytics is an important tool, but must be weighed along with the synthetic tradition.
3.Synthetic Development: By far the most interesting and perhaps the most controversial with glint of academic and theoretical monstrosities included – this represents developing and broadcasting all scenarios equally weighed, and grouping interaction of scenarios. Thus, if introducing a multi-million dollar initiative in untested waters is a decision you have to weigh, one must go through the first two methods, and then review the final outcome against peripheral factors that were not introduced initially. A simple statement or realization like – The competition for Southwest is the Greyhound bus – could significantly alter the expanse of the strategy.
If you think of the new world of finance being nothing more than crunching numbers … stop and think again. Yes …crunching those numbers play a big part, less a cause than an effect of the mental model that you appropriate in this prized profession.
