Blog Archives
Bias and Error: Human and Organizational Tradeoff
“I spent a lifetime trying to avoid my own mental biases. A.) I rub my own nose into my own mistakes. B.) I try and keep it simple and fundamental as much as I can. And, I like the engineering concept of a margin of safety. I’m a very blocking and tackling kind of thinker. I just try to avoid being stupid. I have a way of handling a lot of problems — I put them in what I call my ‘too hard pile,’ and just leave them there. I’m not trying to succeed in my ‘too hard pile.’” : Charlie Munger — 2020 CalTech Distinguished Alumni Award interview
Bias is a disproportionate weight in favor of or against an idea or thing, usually in a way that is closed-minded, prejudicial, or unfair. Biases can be innate or learned. People may develop biases for or against an individual, a group, or a belief. In science and engineering, a bias is a systematic error. Statistical bias results from an unfair sampling of a population, or from an estimation process that does not give accurate results on average.
Error refers to a outcome that is different from reality within the context of the objective function that is being pursued.
Thus, I would like to think that the Bias is a process that might lead to an Error. However, that is not always the case. There are instances where a bias might get you to an accurate or close to an accurate result. Is having a biased framework always a bad thing? That is not always the case. From an evolutionary standpoint, humans have progressed along the dimension of making rapid judgements – and much of them stemming from experience and their exposure to elements in society. Rapid judgements are typified under the System 1 judgement (Kahneman, Tversky) which allows bias and heuristic to commingle to effectively arrive at intuitive decision outcomes.

And again, the decision framework constitutes a continually active process in how humans or/and organizations execute upon their goals. It is largely an emotional response but could just as well be an automated response to a certain stimulus. However, there is a danger prevalent in System 1 thinking: it might lead one to comfortably head toward an outcome that is seemingly intuitive, but the actual result might be significantly different and that would lead to an error in the judgement. In math, you often hear the problem of induction which establishes that your understanding of a future outcome relies on the continuity of the past outcomes, and that is an errant way of thinking although it still represents a useful tool for us to advance toward solutions.
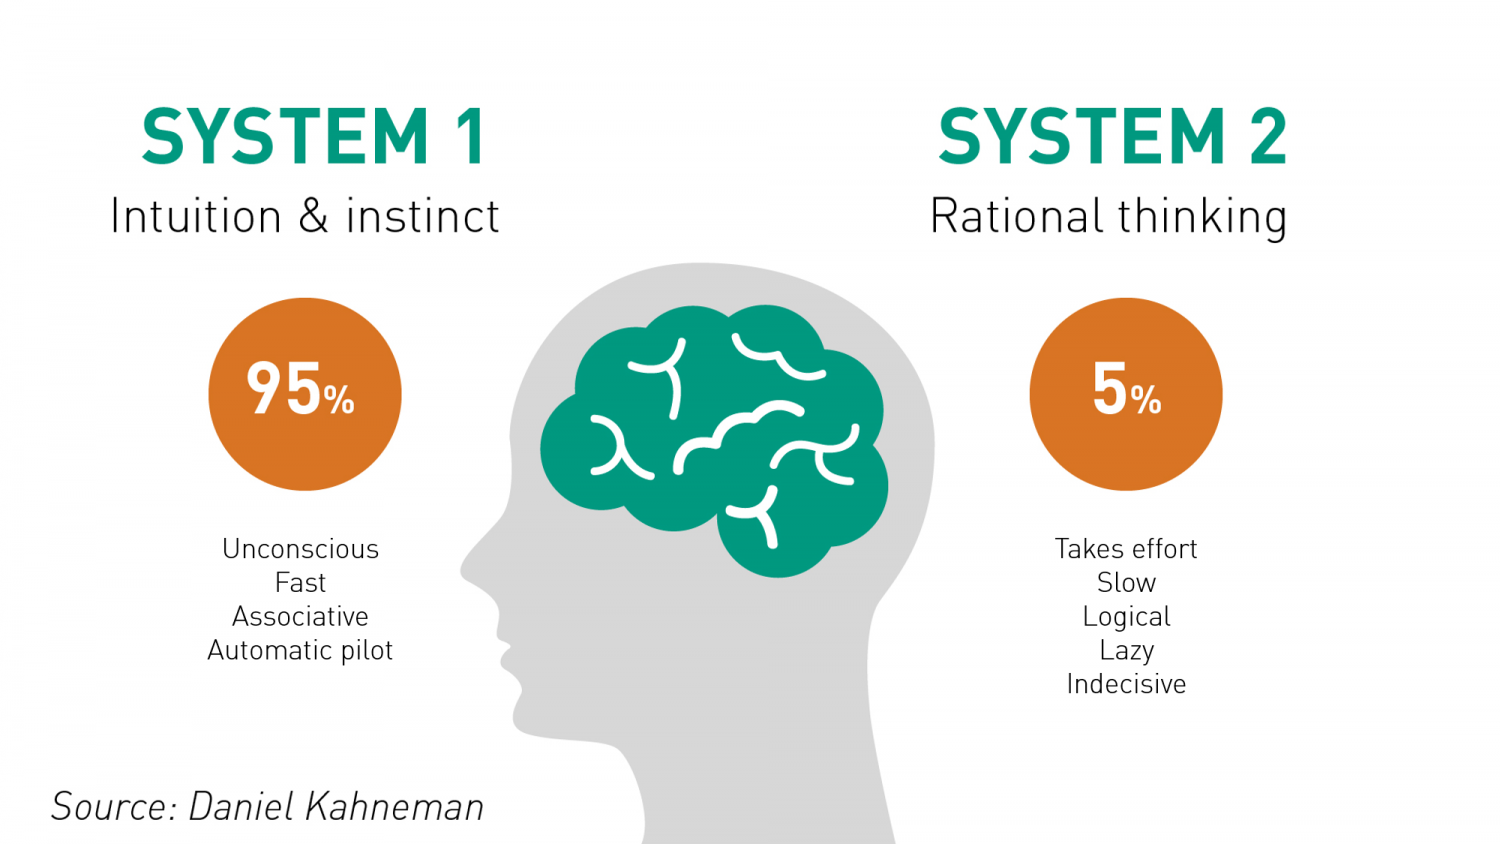
System 2 judgement emerges as another means to temper the more significant variabilities associated with System 1 thinking. System 2 thinking represents a more deliberate approach which leads to a more careful construct of rationale and thought. It is a system that slows down the decision making since it explores the logic, the assumptions, and how the framework tightly fits together to test contexts. There are a more lot more things at work wherein the person or the organization has to invest the time, focus the efforts and amplify the concentration around the problem that has to be wrestled with. This is also the process where you search for biases that might be at play and be able to minimize or remove that altogether. Thus, each of the two Systems judgement represents two different patterns of thinking: rapid, more variable and more error prone outcomes vs. slow, stable and less error prone outcomes.
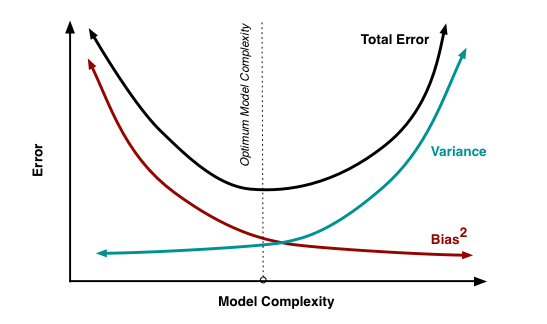
So let us revisit the Bias vs. Variance tradeoff. The idea is that the more bias you bring to address a problem, there is less variance in the aggregate. That does not mean that you are accurate. It only means that there is less variance in the set of outcomes, even if all of the outcomes are materially wrong. But it limits the variance since the bias enforces a constraint in the hypotheses space leading to a smaller and closely knit set of probabilistic outcomes. If you were to remove the constraints in the hypotheses space – namely, you remove bias in the decision framework – well, you are faced with a significant number of possibilities that would result in a larger spread of outcomes. With that said, the expected value of those outcomes might actually be closer to reality, despite the variance – than a framework decided upon by applying heuristic or operating in a bias mode.
So how do we decide then? Jeff Bezos had mentioned something that I recall: some decisions are one-way street and some are two-way. In other words, there are some decisions that cannot be undone, for good or for bad. It is a wise man who is able to anticipate that early on to decide what system one needs to pursue. An organization makes a few big and important decisions, and a lot of small decisions. Identify the big ones and spend oodles of time and encourage a diverse set of input to work through those decisions at a sufficiently high level of detail. When I personally craft rolling operating models, it serves a strategic purpose that might sit on shifting sands. That is perfectly okay! But it is critical to evaluate those big decisions since the crux of the effectiveness of the strategy and its concomitant quantitative representation rests upon those big decisions. Cutting corners can lead to disaster or an unforgiving result!
I will focus on the big whale decisions now. I will assume, for the sake of expediency, that the series of small decisions, in the aggregate or by itself, will not sufficiently be large enough that it would take us over the precipice. (It is also important however to examine the possibility that a series of small decisions can lead to a more holistic unintended emergent outcome that might have a whale effect: we come across that in complexity theory that I have already touched on in a set of previous articles).

Cognitive Biases are the biggest mea culpas that one needs to worry about. Some of the more common biases are confirmation bias, attribution bias, the halo effect, the rule of anchoring, the framing of the problem, and status quo bias. There are other cognition biases at play, but the ones listed above are common in planning and execution. It is imperative that these biases be forcibly peeled off while formulating a strategy toward problem solving.
But then there are also the statistical biases that one needs to be wary of. How we select data or selection bias plays a big role in validating information. In fact, if there are underlying statistical biases, the validity of the information is questionable. Then there are other strains of statistical biases: the forecast bias which is the natural tendency to be overtly optimistic or pessimistic without any substantive evidence to support one or the other case. Sometimes how the information is presented: visually or in tabular format – can lead to sins of the error of omission and commission leading the organization and judgement down paths that are unwarranted and just plain wrong. Thus, it is important to be aware of how statistical biases come into play to sabotage your decision framework.

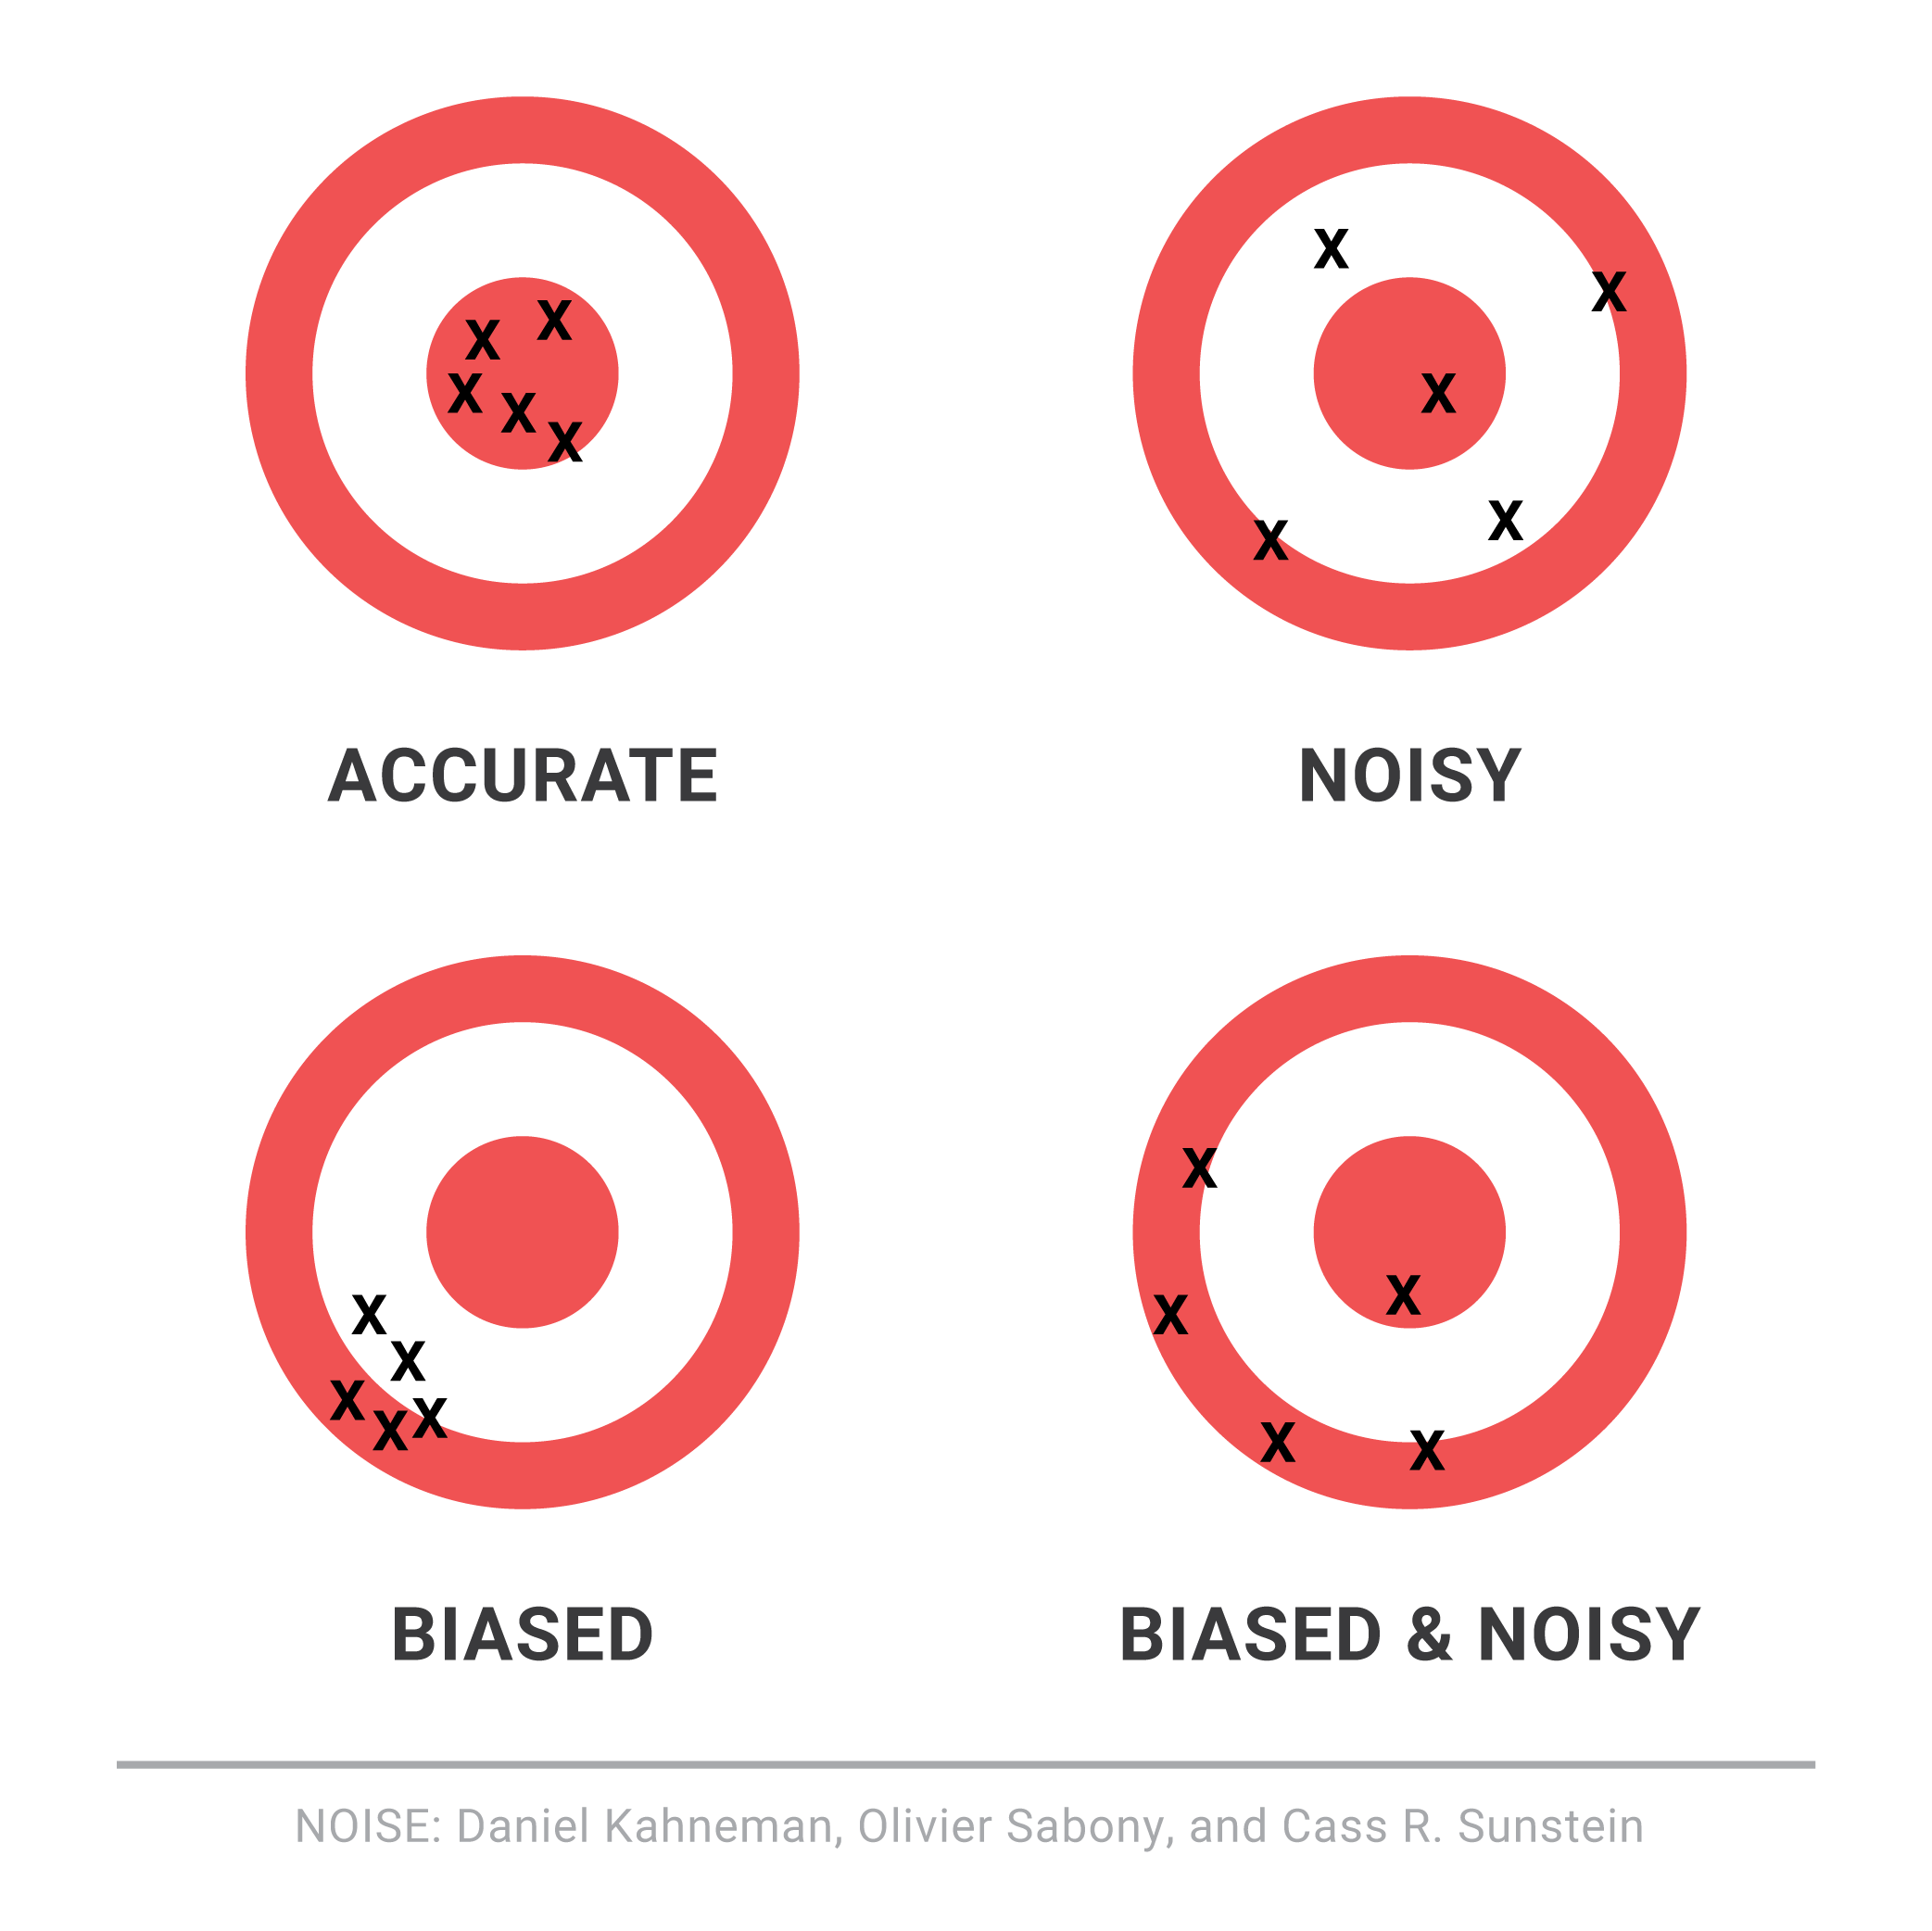
One of the finest illustrations of misjudgment has been laid out by Charlie Munger. Here is the excerpt link : https://fs.blog/great-talks/psychology-human-misjudgment/ He lays out a very comprehensive 25 Biases that ail decision making. Once again, stripping biases do not necessarily result in accuracy — it increases the variability of outcomes that might be clustered around a mean that might be closer to accuracy than otherwise.
Variability is Noise. We do not know a priori what the expected mean is. We are close, but not quite. There is noise or a whole set of outcomes around the mean. Viewing things closer to the ground versus higher would still create a likelihood of accepting a false hypothesis or rejecting a true one. Noise is extremely hard to sift through, but how you can sift through the noise to arrive at those signals that are determining factors, is critical to organization success. To get to this territory, we have eliminated the cognitive and statistical biases. Now is the search for the signal. What do we do then? An increase in noise impairs accuracy. To improve accuracy, you either reduce noise or figure out those indicators that signal an accurate measure.
This is where algorithmic thinking comes into play. You start establishing well tested algorithms in specific use cases and cross-validate that across a large set of experiments or scenarios. It has been proved that algorithmic tools are, in the aggregate, superior to human judgement – since it systematically can surface causal and correlative relationships. Furthermore, special tools like principal component analysis and factory analysis can incorporate a large input variable set and establish the patterns that would be impregnable for even System 2 mindset to comprehend. This will bring decision making toward the signal variants and thus fortify decision making.
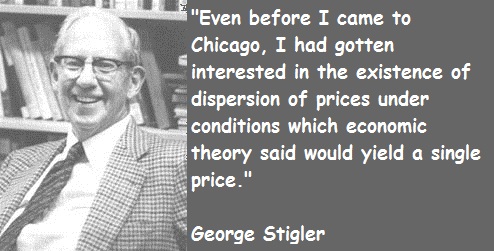
The final element is to assess the time commitment required to go through all the stages. Given infinite time and resources, there is always a high likelihood of arriving at those signals that are material for sound decision making. Alas, the reality of life does not play well to that assumption! Time and resources are constraints … so one must make do with sub-optimal decision making and establish a cutoff point wherein the benefits outweigh the risks of looking for another alternative. That comes down to the realm of judgements. While George Stigler, a Nobel Laureate in Economics, introduce search optimization in fixed sequential search – a more concrete example has been illustrated in “Algorithms to Live By” by Christian & Griffiths. They suggested an holy grail response: 37% is the accurate answer. In other words, you would reach a suboptimal decision by ensuring that you have explored up to 37% of your estimated maximum effort. While the estimated maximum effort is quite ambiguous and afflicted with all of the elements of bias (cognitive and statistical), the best thinking is to be as honest as possible to assess that effort and then draw your search threshold cutoff.
An important element of leadership is about making calls. Good calls, not necessarily the best calls! Calls weighing all possible circumstances that one can, being aware of the biases, bringing in a diverse set of knowledge and opinions, falling back upon agnostic tools in statistics, and knowing when it is appropriate to have learnt enough to pull the trigger. And it is important to cascade the principles of decision making and the underlying complexity into and across the organization.
Model Thinking
| Model Framework |
The fundamental tenet of theory is the concept of “empiria“. Empiria refers to our observations. Based on observations, scientists and researchers posit a theory – it is part of scientific realism.
A scientific model is a causal explanation of how variables interact to produce a phenomenon, usually linearly organized. A model is a simplified map consisting of a few, primary variables that is gauged to have the most explanatory powers for the phenomenon being observed. We discussed Complex Physical Systems and Complex Adaptive Systems early on this chapter. It is relatively easier to map CPS to models than CAS, largely because models become very unwieldy as it starts to internalize more variables and if those variables have volumes of interaction between them. A simple analogy would be the use of multiple regression models: when you have a number of independent variables that interact strongly between each other, autocorrelation errors occur, and the model is not stable or does not have predictive value.

Research projects generally tend to either look at a case study or alternatively, they might describe a number of similar cases that are logically grouped together. Constructing a simple model that can be general and applied to many instances is difficult, if not impossible. Variables are subject to a researcher’s lack of understanding of the variable or the volatility of the variable. What further accentuates the problem is that the researcher misses on the interaction of how the variables play against one another and the resultant impact on the system. Thus, our understanding of our system can be done through some sort of model mechanics but, yet we share the common belief that the task of building out a model to provide all of the explanatory answers are difficult, if not impossible. Despite our understanding of our limitations of modeling, we still develop frameworks and artifact models because we sense in it a tool or set of indispensable tools to transmit the results of research to practical use cases. We boldly generalize our findings from empiria into general models that we hope will explain empiria best. And let us be mindful that it is possible – more so in the CAS systems than CPS that we might have multiple models that would fight over their explanatory powers simply because of the vagaries of uncertainty and stochastic variations.
Popper says: “Science does not rest upon rock-bottom. The bold structure of its theories rises, as it were, above a swamp. It is like a building erected on piles. The piles are driven down from above into the swamp, but not down to any natural or ‘given’ base; and when we cease our attempts to drive our piles into a deeper layer, it is not because we have reached firm ground. We simply stop when we are satisfied that they are firm enough to carry the structure, at least for the time being”. This leads to the satisficing solution: if a model can choose the least number of variables to explain the greatest amount of variations, the model is relatively better than other models that would select more variables to explain the same. In addition, there is always a cost-benefit analysis to be taken into consideration: if we add x number of variables to explain variation in the outcome but it is not meaningfully different than variables less than x, then one would want to fall back on the less-variable model because it is less costly to maintain.
Researchers must address three key elements in the model: time, variation and uncertainty. How do we craft a model which reflects the impact of time on the variables and the outcome? How to present variations in the model? Different variables might vary differently independent of one another. How do we present the deviation of the data in a parlance that allows us to make meaningful conclusions regarding the impact of the variations on the outcome? Finally, does the data that is being considered are actual or proxy data? Are the observations approximate? How do we thus draw the model to incorporate the fuzziness: would confidence intervals on the findings be good enough?
Two other equally other concepts in model design is important: Descriptive Modeling and Normative Modeling.
Descriptive models aim to explain the phenomenon. It is bounded by that goal and that goal only.
There are certain types of explanations that they fall back on: explain by looking at data from the past and attempting to draw a cause and effect relationship. If the researcher is able to draw a complete cause and effect relationship that meets the test of time and independent tests to replicate the results, then the causality turns into law for the limited use-case or the phenomenon being explained. Another explanation method is to draw upon context: explaining a phenomenon by looking at the function that the activity fulfills in its context. For example, a dog barks at a stranger to secure its territory and protect the home. The third and more interesting type of explanation is generally called intentional explanation: the variables work together to serve a specific purpose and the researcher determines that purpose and thus, reverse engineers the understanding of the phenomenon by understanding the purpose and how the variables conform to achieve that purpose.
This last element also leads us to thinking through the other method of modeling – namely, normative modeling. Normative modeling differs from descriptive modeling because the target is not to simply just gather facts to explain a phenomenon, but rather to figure out how to improve or change the phenomenon toward a desirable state. The challenge, as you might have already perceived, is that the subjective shadow looms high and long and the ultimate finding in what would be a normative model could essentially be a teleological representation or self-fulfilling prophecy of the researcher in action. While this is relatively more welcome in a descriptive world since subjectivism is diffused among a larger group that yields one solution, it is not the best in a normative world since variation of opinions that reflect biases can pose a problem.
How do we create a representative model of a phenomenon? First, we weigh if the phenomenon is to be understood as a mere explanation or to extend it to incorporate our normative spin on the phenomenon itself. It is often the case that we might have to craft different models and then weigh one against the other that best represents how the model can be explained. Some of the methods are fairly simple as in bringing diverse opinions to a table and then agreeing upon one specific model. The advantage of such an approach is that it provides a degree of objectivism in the model – at least in so far as it removes the divergent subjectivity that weaves into the various models. Other alternative is to do value analysis which is a mathematical method where the selection of the model is carried out in stages. You define the criteria of the selection and then the importance of the goal (if that be a normative model). Once all of the participants have a general agreement, then you have the makings of a model. The final method is to incorporate all all of the outliers and the data points in the phenomenon that the model seeks to explain and then offer a shared belief into those salient features in the model that would be best to apply to gain information of the phenomenon in a predictable manner.
There are various languages that are used for modeling:
Written Language refers to the natural language description of the model. If price of butter goes up, the quantity demanded of the butter will go down. Written language models can be used effectively to inform all of the other types of models that follow below. It often goes by the name of “qualitative” research, although we find that a bit limiting. Just a simple statement like – This model approximately reflects the behavior of people living in a dense environment …” could qualify as a written language model that seeks to shed light on the object being studied.
Icon Models refer to a pictorial representation and probably the earliest form of model making. It seeks to only qualify those contours or shapes or colors that are most interesting and relevant to the object being studied. The idea of icon models is to pictorially abstract the main elements to provide a working understanding of the object being studied.
Topological Models refer to how the variables are placed with respect to one another and thus helps in creating a classification or taxonomy of the model. Once can have logical trees, class trees, Venn diagrams, and other imaginative pictorial representation of fields to further shed light on the object being studied. In fact, pictorial representations must abide by constant scale, direction and placements. In other words, if the variables are placed on a different scale on different maps, it would be hard to draw logical conclusions by sight alone. In addition, if the placements are at different axis in different maps or have different vectors, it is hard to make comparisons and arrive at a shared consensus and a logical end result.
Arithmetic Models are what we generally fall back on most. The data is measured with an arithmetic scale. It is done via tables, equations or flow diagrams. The nice thing about arithmetic models is that you can show multiple dimensions which is not possible with other modeling languages. Hence, the robustness and the general applicability of such models are huge and thus is widely used as a key language to modeling.
Analogous Models refer to crafting explanations using the power of analogy. For example, when we talk about waves – we could be talking of light waves, radio waves, historical waves, etc. These metaphoric representations can be used to explain phenomenon, but at best, the explanatory power is nebulous, and it would be difficult to explain the variations and uncertainties between two analogous models. However, it still is used to transmit information quickly through verbal expressions like – “Similarly”, “Equivalently”, “Looks like ..” etc. In fact, extrapolation is a widely used method in modeling and we would ascertain this as part of the analogous model to a great extent. That is because we time-box the variables in the analogous model to one instance and the extrapolated model to another instance and we tie them up with mathematical equations.
