Category Archives: Financial Metrics

Beyond the Buzz: The Real Economics Behind SaaS, AI, and Everything in Between
Introduction
Throughout my career, I have had the privilege of working in and leading finance teams across several SaaS companies. The SaaS model is familiar territory to me: its economics are well understood, its metrics are measurable, and its value creation pathways have been tested over time. Erich Mersch’s book on SaaS Hacks is my Bible. In contrast, my exposure to pure AI companies has been more limited. I have directly supported two AI-driven businesses, and much of my perspective comes from observation, benchmarking, and research. This combination of direct experience and external study has hopefully shaped a balanced view: one grounded in practicality yet open to the new dynamics emerging in the AI era.
Across both models, one principle remains constant: a business is only as strong as its unit economics. When leaders understand the economics of their business, they gain the ability to map them to daily operations, and from there, to the financial model. The linkage from unit economics to operations to financial statements is what turns financial insight into strategic control. It ensures that decisions on pricing, product design, and investment are all anchored in how value is truly created and captured.
Today, CFOs and CEOs must not only manage their profit and loss (P&L) statement but also understand the anatomy of revenue, cost, and cash flow at the micro level. SaaS, AI, and hybrid SaaS-AI models each have unique economic signatures. SaaS rewards scalability and predictability. AI introduces variability and infrastructure intensity. Hybrids offer both opportunity and complexity. This article examines the financial structure, gross margin profile, and investor lens of each model to help finance leaders not only measure performance but also interpret it by turning data into judgment and judgment into a better strategy.
Part I: SaaS Companies — Economics, Margins, and Investor Lens
The heart of any SaaS business is its recurring revenue model. Unlike traditional software, where revenue is recognized upfront, SaaS companies earn revenue over time as customers subscribe to a service. This shift from ownership to access creates predictable revenue streams but also introduces delayed payback cycles and continuous obligations to deliver value. Understanding the unit economics behind this model is essential for CFOs and CEOs, as it enables them to see beyond top-line growth and assess whether each customer, contract, or cohort truly creates long-term value.
A strong SaaS company operates like a flywheel. Customer acquisition drives recurring revenue, which funds continued innovation and improved service, in turn driving more customer retention and referrals. But a flywheel is only as strong as its components. The economics of SaaS can be boiled down to a handful of measurable levers: gross margin, customer acquisition cost, retention rate, lifetime value, and cash efficiency. Each one tells a story about how the company converts growth into profit.
The SaaS Revenue Engine
At its simplest, a SaaS company makes money by providing access to its platform on a subscription basis. The standard measure of health is Annual Recurring Revenue (ARR). ARR represents the contracted annualized value of active subscriptions. It is the lifeblood metric of the business. When ARR grows steadily with low churn, the company can project future cash flows with confidence.
Revenue recognition in SaaS is governed by time. Even if a customer pays upfront, the revenue is recognized over the duration of the contract. This creates timing differences between bookings, billings, and revenue. CFOs must track all three to understand both liquidity and profitability. Bookings signal demand, billings signal cash inflow, and revenue reflects the value earned.
One of the most significant advantages of SaaS is predictability. High renewal rates lead to stable revenues. Upsells and cross-sells increase customer lifetime value. However, predictability can also mask underlying inefficiencies. A SaaS business can grow fast and still destroy value if each new customer costs more to acquire than they bring in lifetime revenue. This is where unit economics comes into play.
Core Unit Metrics in SaaS
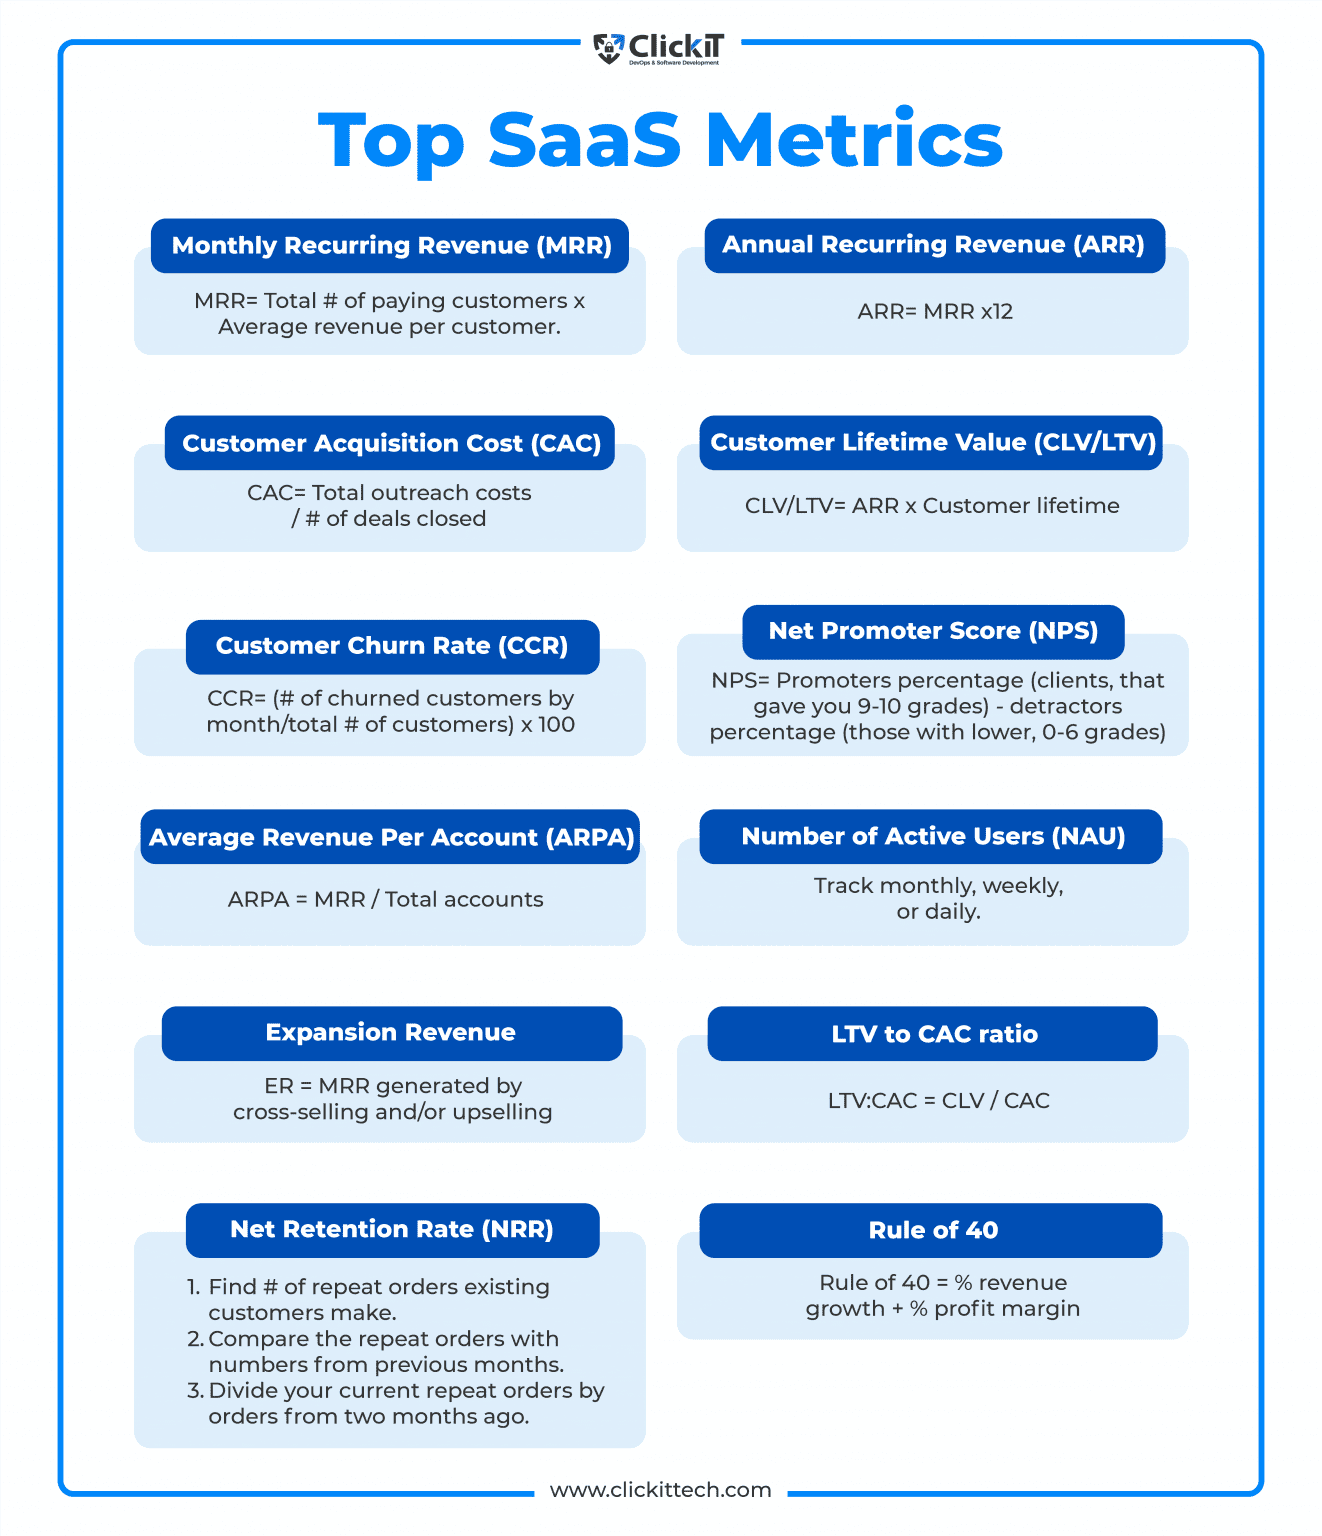
The three central metrics every CFO and CEO must know are:
- Customer Acquisition Cost (CAC): The total sales and marketing expenses needed to acquire one new customer.
- Lifetime Value (LTV): The total revenue a customer is expected to generate over their relationship with the company.
- Payback Period: The time it takes for gross profit from a customer to recover CAC.
A healthy SaaS business typically maintains an LTV-to-CAC ratio of at least 3:1. This means that for every dollar spent acquiring a customer, the company earns three dollars in lifetime value. Payback periods under twelve months are typically considered strong, especially in mid-market or enterprise SaaS. Long payback periods signal cash inefficiency and high-risk during downturns.
Retention is equally essential. The stickier the product, the lower the churn, and the more predictable the revenue. Net revenue retention (NRR) is a powerful metric because it combines churn and expansion. A business with 120 percent NRR is growing revenue even without adding new customers, which investors love to see.
Gross Margin Dynamics
Gross margin is the backbone of SaaS profitability. It measures how much of each revenue dollar remains after deducting direct costs, such as hosting, support, and third-party software fees. Well-run SaaS companies typically achieve gross margins of between 75% and 85%. This reflects the fact that software is highly scalable. Once built, it can be replicated at almost no additional cost. They use the margins to fund their GTM strategy. They have room until they don’t.
However, gross margin is not guaranteed. In practice, it can erode for several reasons. First, rising cloud infrastructure costs can quietly eat into margins if not carefully managed. Companies that rely heavily on AWS, Azure, or Google Cloud need cost optimization strategies, including reserved instances and workload tuning. Second, customer support and success functions, while essential, can become heavy if processes are not automated. Third, complex integrations or data-heavy products can increase variable costs per customer.
Freemium and low-entry pricing models can also dilute margins if too many users remain on free tiers or lower-paying plans. The CFO’s job is to ensure that pricing reflects the actual value delivered and that the cost-to-serve remains aligned with revenue per user. A mature SaaS company tracks unit margins by customer segment to identify where profitability thrives or erodes.
Operating Leverage and the Rule of 40
The power of SaaS lies in its potential for operating leverage. Fixed costs, such as R&D, engineering, and sales infrastructure, remain relatively constant as revenue scales. As a result, incremental revenue flows disproportionately to the bottom line once the business passes break-even. This makes SaaS an attractive model once scale is achieved, although reaching that scale can take a considerable amount of time.
The Rule of 40 is a shorthand metric many investors use to gauge the balance between growth and profitability. It states that a SaaS company’s revenue growth rate, plus its EBITDA margin, should equal or exceed 40 percent. A company growing 30 percent annually with a 15 percent EBITDA margin scores 45, which is considered healthy. A company growing at 60 percent but losing 30 percent EBITDA would score 30, suggesting inefficiency. This rule forces management to strike a balance between ambition and discipline. This 40% rule was based on empirical analysis, and every Jack and Jill swears by it. I am not sure that we can have this Rule and apply it blindly. I am not generally in favor of these broad rules. That is a lot of fodder for a different conversation.
Cash Flow and Efficiency
Cash flow timing is another defining feature of SaaS. Many customers prepay annually, creating favorable working capital dynamics. This gives SaaS companies negative net working capital, which can help fund growth. However, high upfront CAC and long payback periods can strain cash reserves. CFOs must ensure growth is financed efficiently and that burn multiples remain sustainable. Burn-multiple measures the cash burn relative to net new ARR added. A burn rate of multiple below 1 is excellent; it means the company spends one dollar to generate one dollar of recurring revenue. Ratios above 2 suggest inefficiency.
As markets have tightened, investors have shifted focus from pure growth to efficient growth. Cash is no longer cheap, and dilution from equity raises is costly. I attended a networking event in San Jose about a month ago, and one of the finance leaders said, “We are in the middle of a nuclear winter.” I thought that summarized the current state of the funding market. Therefore, SaaS CFOs must guide companies toward self-funding growth, improving gross margins, and shortening CAC payback cycles.
Valuation and Investor Perspective
Investors view SaaS companies through the lens of predictability, scalability, and margin potential. Historically, during low-interest-rate periods, high-growth SaaS companies traded at 10 to 15 times ARR. In the current normalized environment, top performers trade between 5 and 8 times ARR, with discounts for slower growth or lower margins.
The key drivers of valuation include:
- Growth Rate: Faster ARR growth leads to higher multiples, provided it is efficient.
- Gross Margin: High margins indicate scalability and control over cost structure.
- Retention and Expansion: Strong NRR signals durable revenue and pricing power.
- Profitability Trajectory: Investors reward companies that balance growth with clear paths to cash flow breakeven.
Investors now differentiate between the quality of growth and the quantity of growth. Revenue driven by deep discounts or heavy incentives is less valuable than revenue driven by customer adoption and satisfaction. CFOs must clearly communicate cohort performance, renewal trends, and contribution margins to demonstrate that growth is sustainable and durable.
Emerging Challenges in SaaS Economics
While SaaS remains a powerful model, new challenges have emerged. Cloud infrastructure costs are rising, putting pressure on gross margins. AI features are becoming table stakes, but they introduce new variable costs tied to compute. Customer expectations are also shifting toward usage-based pricing, which can lead to reduced predictability in revenue recognition.
To navigate these shifts, CFOs must evolve their financial reporting and pricing strategies. Gross margin analysis must now include compute efficiency metrics. Sales compensation plans must reflect profitability, not just bookings. Pricing teams must test elasticity to ensure ARPU growth outpaces cost increases.
SaaS CFOs must also deepen their understanding of cohort economics. Not all customers are equal. Some segments deliver faster payback and higher retention, while others create drag. Segmented reporting enables management to allocate capital wisely and avoid pursuing unprofitable markets.
The Path Forward
The essence of SaaS unit economics is discipline. Growth only creates value when each unit of growth strengthens the financial foundation. This requires continuous monitoring of margins, CAC, retention, and payback. It also requires cross-functional collaboration between finance, product, and operations. Finance must not only report outcomes but also shape strategy, ensuring that pricing aligns with value and product decisions reflect cost realities.
For CEOs, understanding these dynamics is vital to setting priorities. For CFOs, the task is to build a transparent model that links operational levers to financial outcomes. Investors reward companies that can tell a clear story with data: a path from top-line growth to sustainable free cash flow.
Ultimately, SaaS remains one of the most attractive business models when executed effectively. The combination of recurring revenue, high margins, and operating leverage creates long-term compounding value. But it rewards precision. The CFO who masters unit economics can turn growth into wealth, while the one who ignores it may find that scale without discipline is simply a faster road to inefficiency. The king is not dead: Long live the king.
Part II: Pure AI Companies — Economics, Margins, and Investor Lens
Artificial intelligence companies represent a fundamentally different business model from traditional SaaS. Where SaaS companies monetize access to pre-built software, AI companies monetize intelligence: the ability of models to learn, predict, and generate. This shift changes everything about unit economics. The cost per unit of value is no longer near zero. It is tied to the underlying cost of computation, data processing, and model maintenance. As a result, CFOs and CEOs leading AI-first companies must rethink what scale, margin, and profitability truly mean.
While SaaS scales easily once software is built, AI scales conditionally. Each customer interaction may trigger new inference requests, consume GPU time, and incur variable costs. Every additional unit of demand brings incremental expenses. The CFO’s challenge is to translate these technical realities into financial discipline, which involves building an organization that can sustain growth without being constrained by its own cost structure.
Understanding the AI Business Model
AI-native companies generate revenue by providing intelligence as a service. Their offerings typically fall into three categories:
- Platform APIs: Selling access to models that perform tasks such as image recognition, text generation, or speech processing.
- Enterprise Solutions: Custom model deployments tailored for specific industries like healthcare, finance, or retail.
- Consumer Applications: AI-powered tools like copilots, assistants, or creative generators.
Each model has unique economics. API-based businesses often employ usage-based pricing, resembling utilities. Enterprise AI firms resemble consulting hybrids, blending software with services. Consumer AI apps focus on scale, requiring low-cost inference to remain profitable.
Unlike SaaS subscriptions, AI revenue is often usage-driven. This makes it more elastic but less predictable. When customers consume more tokens, queries, or inferences, revenue rises but so do costs. This tight coupling between revenue and cost means margins depend heavily on technical efficiency. CFOs must treat cost-per-inference as a central KPI, just as SaaS leaders track gross margin percentage.
Gross Margins and Cost Structures
For pure AI companies, the gross margin reflects the efficiency of their infrastructure. In the early stages, margins often range between 40% and 60%. With optimization, some mature players approach 70 percent or higher. However, achieving SaaS-like margins requires significant investment in optimization techniques, such as model compression, caching, and hardware acceleration.
The key cost components include:
- Compute: GPU and cloud infrastructure costs are the most significant variable expenses. Each inference consumes compute cycles, and large models require expensive hardware.
- Data: Training and fine-tuning models involve significant data acquisition, labeling, and storage costs.
- Serving Infrastructure: Orchestration, latency management, and load balancing add further expenses.
- Personnel: Machine learning engineers, data scientists, and research teams represent high fixed costs.
Unlike SaaS, where the marginal cost per user declines toward zero, AI marginal costs can remain flat or even rise with increasing complexity. The more sophisticated the model, the more expensive it is to serve each request. CFOs must therefore design pricing strategies that match the cost-to-serve, ensuring unit economics remain positive.
To track progress, leading AI finance teams adopt new metrics such as cost per 1,000 tokens, cost per inference, or cost per output. These become the foundation for gross margin improvement programs. Without these metrics, management cannot distinguish between profitable and loss-making usage.
Capital Intensity and Model Training
A defining feature of AI economics is capital intensity. Training large models can cost tens or even hundreds of millions of dollars. These are not operating expenses in the traditional sense; they are long-term investments. The question for CFOs is how to treat them. Should they be expensed, like research and development, or capitalized, like long-lived assets? The answer depends on accounting standards and the potential for model reuse.
If a model will serve as a foundation for multiple products or customers over several years, partial capitalization may be a defensible approach. However, accounting conservatism often favors expensing, which depresses near-term profits. Regardless of treatment, management must view training costs as sunk investments that must earn a return through widespread reuse.
Due to these high upfront costs, AI firms must carefully plan their capital allocation. Not every model warrants training from scratch. Fine-tuning open-source or pre-trained models may achieve similar outcomes at a fraction of the cost. The CFO’s role is to evaluate return on invested capital in R&D and ensure technical ambition aligns with commercial opportunity.
Cash Flow Dynamics
Cash flow management in AI businesses is a significant challenge. Revenue often scales more slowly than costs in early phases. Infrastructure bills accrue monthly, while customers may still be in pilot stages. This results in negative contribution margins and high burn rates. Without discipline, rapid scaling can amplify losses.
The path to positive unit economics comes from optimization. Model compression, quantization, and batching can lower the cost per inference. Strategic use of lower-cost hardware, such as CPUs for lighter tasks, can also be beneficial. Some firms pursue vertical integration, building proprietary chips or partnering for preferential GPU pricing. Others use caching and heuristic layers to reduce the number of repeated inference calls.
Cash efficiency improves as AI companies move from experimentation to productization. Once a model stabilizes and workload patterns become predictable, cost forecasting and margin planning become more reliable. CFOs must carefully time their fundraising and growth, ensuring the company does not overbuild infrastructure before demand materializes.
Pricing Strategies
AI pricing remains an evolving art. Standard models include pay-per-use, subscription tiers with usage caps, or hybrid pricing that blends base access fees with variable usage charges. The proper structure depends on the predictability of usage, customer willingness to pay, and cost volatility.
Usage-based pricing aligns revenue with cost but increases forecasting uncertainty. Subscription pricing provides stability but can lead to margin compression if usage spikes. CFOs often employ blended approaches, utilizing base subscriptions that cover average usage, with additional fees for exceeding demand. This provides a buffer against runaway costs while maintaining customer flexibility.
Transparent pricing is crucial. Customers need clarity about what drives cost. Complexity breeds disputes and churn. Finance leaders should collaborate with product and sales teams to develop pricing models that are straightforward, equitable, and profitable. Scenario modeling helps anticipate edge cases where heavy usage erodes margins.
Valuation and Investor Perspective
Investors evaluate AI companies through a different lens than SaaS. Because AI is still an emerging field, investors look beyond current profitability and focus on technical moats, data advantages, and the scalability of cost curves. A strong AI company demonstrates three things:
- Proprietary Model or Data: Access to unique data sets or model architectures that competitors cannot easily replicate.
- Cost Curve Mastery: A clear path to reducing cost per inference as scale grows.
- Market Pull: Evidence of real-world demand and willingness to pay for intelligence-driven outcomes.
Valuations often blend software multiples with hardware-like considerations. Early AI firms may be valued at 6 to 10 times forward revenue if they show strong growth and clear cost reduction plans. Companies perceived as purely research-driven, without commercial traction, face steeper discounts. Investors are increasingly skeptical of hype and now seek proof of sustainable margins.
In diligence, investors focus on gross margin trajectory, data defensibility, and customer concentration. They ask questions like: How fast is the cost per inference declining? What portion of revenue comes from repeat customers? How dependent is the business on third-party models or infrastructure? The CFO’s job is to prepare crisp, data-backed answers.
Measuring Efficiency and Scale
AI CFOs must introduce new forms of cost accounting. Traditional SaaS dashboards that focus solely on ARR and churn are insufficient. AI demands metrics that link compute usage to financial outcomes. Examples include:
- Compute Utilization Rate: Percentage of GPU capacity effectively used.
- Model Reuse Ratio: Number of applications or customers served by a single trained model.
- Cost per Output Unit: Expense per generated item, prediction, or token.
By tying these technical metrics to revenue and gross margin, CFOs can guide engineering priorities. Finance becomes a strategic partner in improving efficiency, not just reporting cost overruns. In a later article, we will discuss complexity and Scale. I am writing a book on that subject, and this is highly relevant to how AI-based businesses are evolving. It is expected to be released by late February next year and will be available on Kindle as an e-book.
Risk Management and Uncertainty
AI companies face unique risks. Dependence on external cloud providers introduces pricing and supply risks. Regulatory scrutiny over data usage can limit access to models or increase compliance costs. Rapid technological shifts may render models obsolete before their amortization is complete. CFOs must build contingency plans, diversify infrastructure partners, and maintain agile capital allocation processes.
Scenario planning is essential. CFOs should model high, medium, and low usage cases with corresponding cost structures. Sensitivity analysis on cloud pricing, GPU availability, and demand elasticity helps avoid surprises. Resilience matters as much as growth.
The Path Forward
For AI companies, the journey to sustainable economics is one of learning curves. Every technical improvement that reduces the cost per unit enhances the margin. Every dataset that improves model accuracy also enhances customer retention. Over time, these compounding efficiencies create leverage like SaaS, but the path is steeper.
CFOs must view AI as a cost-compression opportunity. The winners will not simply have the best models but the most efficient ones. Investors will increasingly value businesses that show declining cost curves, strong data moats, and precise product-market fit.
For CEOs, the message is focus. Building every model from scratch or chasing every vertical can drain capital. The best AI firms choose their battles wisely, investing deeply in one or two defensible areas. Finance leaders play a crucial role in guiding these choices with evidence, rather than emotion.
In summary, pure AI companies operate in a world where scale is earned, not assumed. The economics are challenging but not insurmountable. With disciplined pricing, rigorous cost tracking, and clear communication to investors, AI businesses can evolve from capital-intensive experiments into enduring, high-margin enterprises. The key is turning intelligence into economics and tackling it one inference at a time.
Part III: SaaS + AI Hybrid Models: Economics and Investor Lens
In today’s market, most SaaS companies are no longer purely software providers. They are becoming intelligence platforms, integrating artificial intelligence into their products to enhance customer value. These hybrid models combine the predictability of SaaS with the innovation of AI. They hold great promises, but they also introduce new complexities in economics, margin structure, and investor expectations. For CFOs and CEOs, the challenge is not just understanding how these elements coexist but managing them in harmony to deliver profitable growth.
The hybrid SaaS-AI model is not simply the sum of its parts. It requires balancing two different economic engines: one that thrives on recurring, high-margin revenue and another that incurs variable costs linked to compute usage. The key to success lies in recognizing where AI enhances value and where it risks eroding profitability. Leaders who can measure, isolate, and manage these dynamics can unlock superior economics and investor confidence.
The Nature of Hybrid SaaS-AI Businesses
A hybrid SaaS-AI company starts with a core subscription-based platform. Customers pay recurring fees for access, support, and updates. Additionally, the company leverages AI-powered capabilities to enhance automation, personalization, analytics, and decision-making. These features can be embedded into existing workflows or offered as add-ons, sometimes billed based on usage.
Examples include CRMs with AI-assisted forecasting, HR platforms with intelligent candidate screening, or project tools with predictive insights. In each case, AI transforms user experience and perceived value, but it also introduces incremental cost per transaction. Every inference call, data model query, or real-time prediction consumes compute power and storage.
This hybridization reshapes the traditional SaaS equation. Revenue predictability remains strong due to base subscriptions, but gross margins become more variable. CFOs must now consider blended margins and segment economics. The task is to ensure that AI features expand total lifetime value faster than they inflate cost-to-serve.
Dual Revenue Streams and Pricing Design
Hybrid SaaS-AI companies often operate with two complementary revenue streams:
- Subscription Revenue: Fixed or tiered recurring revenue, predictable and contract-based.
- Usage-Based Revenue: Variable income tied to AI consumption, such as per query, token, or transaction.
This dual model offers flexibility. Subscriptions provide stability, while usage-based revenue captures upside from heavy engagement. However, it also complicates forecasting. CFOs must model revenue variance under various usage scenarios and clearly communicate these assumptions to the Board and investors.
Pricing design becomes a strategic lever. Some firms include AI features in premium tiers to encourage upgrades. Others use consumption pricing, passing compute costs directly to customers. The right approach depends on customer expectations, cost structure, and product positioning. For enterprise markets, predictable pricing is often a preferred option. For developer- or API-driven products, usage-based pricing aligns better with the delivery of value.
The most effective hybrid models structure pricing so that incremental revenue per usage exceeds incremental cost per usage. This ensures positive unit economics across both streams. Finance teams should run sensitivity analyses to test break-even points and adjust thresholds as compute expenses fluctuate.
Gross Margin Bifurcation
Gross margin in hybrid SaaS-AI companies must be analyzed in two layers:
- SaaS Core Margin: Typically, 75 to 85 percent is driven by software delivery, hosting, and support.
- AI Layer Margin: Often 40 to 60 percent, and it depends on compute efficiency and pricing.
When blended, the total margin may initially decline, especially if AI usage grows faster than subscription base revenue. The risk is that rising compute costs erode profitability before pricing can catch up. To manage this, CFOs should report segmented gross margins to the Board. This transparency helps avoid confusion when consolidated margins fluctuate.
The goal is not to immediately maximize blended margins, but to demonstrate a credible path toward margin expansion through optimization. Over time, as AI models become more efficient and the cost per inference declines, blended margins can recover. Finance teams should measure and communicate progress in terms of margin improvement per usage unit, not just overall percentages.
Impact on Customer Economics
AI features can materially improve customer economics. They increase stickiness, reduce churn, and create opportunities for upsell. A customer who utilizes AI-driven insights or automation tools is more likely to renew, as the platform becomes an integral part of their workflow. This improved retention directly translates into a higher lifetime value.
In some cases, AI features can also justify higher pricing or premium tiers. The key is measurable value. Customers pay more when they see clear ROI: for example, faster decision-making, labor savings, or improved accuracy. CFOs should work with product and customer success teams to quantify these outcomes and use them in renewal and pricing discussions.
The critical financial question is whether AI-enhanced LTV grows faster than CAC and variable cost. If so, AI drives profitable growth. If not, it becomes an expensive feature rather than a revenue engine. Regular cohort analysis helps ensure that AI adoption is correlated with improved unit economics.
Operating Leverage and Efficiency
Hybrid SaaS-AI companies must rethink operating leverage. Traditional SaaS gains leverage by spreading fixed costs over recurring revenue. In contrast, AI introduces variable costs tied to usage. This weakens the traditional leverage model. To restore it, finance leaders must focus on efficiency levers within AI operations.
Techniques such as caching, batching, and model optimization can reduce compute costs per request. Partnering with cloud providers for reserved capacity or leveraging model compression can further improve cost efficiency. The finance team’s role is to quantify these savings and ensure engineering priorities align with economic goals.
Another form of leverage comes from data reuse. The more a single model or dataset serves multiple customers or use cases, the higher the effective ROI on data and training investment. CFOs should track data utilization ratios and model reuse metrics as part of their financial dashboards.
Cash Flow and Capital Planning
Cash flow in hybrid businesses depends on the balance between stable subscription inflows and variable infrastructure outflows. CFOs must forecast not only revenue but also compute consumption. During early rollout, AI usage can spike unpredictably, leading to cost surges. Scenario planning is essential. Building buffers into budgets prevents margin shocks.
Capital allocation should prioritize scalability. Investments in AI infrastructure should follow demonstrated demand, not speculative projections. Over-provisioning GPU capacity can result in unnecessary cash expenditures. Many firms start with cloud credits or pay-as-you-go models before committing to long-term leases or hardware purchases. The objective is to match the cost ramp with revenue realization.
As with SaaS, negative working capital from annual prepayments can be used to fund expansion. However, CFOs should reserve portions of this cash for compute variability and cost optimization initiatives.
Investor Perspective
Investors view hybrid SaaS-AI models with both enthusiasm and scrutiny. They appreciate the potential for differentiation and pricing power, but expect clear evidence that AI integration enhances, rather than dilutes, economics. The investment thesis often centers on three questions:
- Does AI materially increase customer lifetime value?
- Can the company sustain or improve gross margins as AI usage scales?
- Is there a clear path to efficient growth under the Rule of 40?
Companies that answer yes to all three earn premium valuations. Investors will typically apply core SaaS multiples (5 to 8 times Annual Recurring Revenue, or ARR) with modest uplifts if AI features drive measurable revenue growth. However, if AI costs are poorly controlled or margins decline, valuations compress quickly.
To maintain investor confidence, CFOs must provide transparency. This includes segmented reporting, sensitivity scenarios, and clear explanations of cost drivers. Investors want to see not just innovation, but financial stewardship.
Strategic Positioning
The strategic role of AI within a SaaS company determines how investors perceive it. There are three broad positioning models:
- AI as a Feature: Enhances existing workflows but is not core to monetization. Example: an email scheduling tool with AI suggestions.
- AI as a Co-Pilot: Drives user productivity and becomes central to customer experience. Example: CRM with AI-generated insights.
- AI as a Platform: Powers entire ecosystems and opens new revenue lines. Example: a developer platform offering custom AI models.
Each model carries different costs and pricing implications. CFOs should ensure that the company’s financial model aligns with its strategic posture. A feature-based AI approach should be margin-accretive. A platform-based approach may accept lower margins initially in exchange for future ecosystem revenue.
Risk Management and Governance
Hybrid models also introduce new risks. Data privacy, model bias, and regulatory compliance can create unexpected liabilities. CFOs must ensure robust governance frameworks are in place. Insurance, audit, and legal teams should work closely together to manage exposure effectively. Transparency in AI decision-making builds customer trust and reduces reputational risk.
Another risk is dependency on third-party models or APIs. Companies that use external large language models face risks related to cost and reliability. CFOs should evaluate the total cost of ownership between building and buying AI capabilities. Diversifying across providers or developing proprietary models can mitigate concentration risk.
The CFO’s Role
In hybrid SaaS-AI organizations, the CFO’s role expands beyond financial reporting. Finance becomes the integrator of technology, strategy, and economics. The CFO must help design pricing strategies, measure the cost-to-serve, and effectively communicate value to investors. This requires fluency in both financial and technical language.
Regular dashboards should include metrics such as blended gross margin, compute cost per user, AI utilization rate, and LTV uplift resulting from AI adoption. This data-driven approach allows management to make informed trade-offs between innovation and profitability.
The CFO also acts as an educator. Boards and investors may not yet be familiar with AI-driven cost structures. Clear, simple explanations build confidence and support strategic decisions.
The Path Forward
The future belongs to companies that combine SaaS predictability with AI intelligence. Those who succeed will treat AI not as a novelty but as an economic engine. They will manage AI costs with the same rigor they apply to headcount or cloud spend. They will design pricing that reflects value creation, not just usage volume. And they will communicate to investors how each new AI feature strengthens the overall financial model.
Hybrid SaaS-AI companies occupy the forefront of modern business economics. They demonstrate that innovation and discipline are not opposites, but they are partners working toward a common objective. For CFOs and CEOs, the path forward is clear: measure what matters, value price, and guide the organization with transparency and foresight. Over time, this combination of creativity and control will separate enduring leaders from experimental wanderers.
Summary
In every business model, clarity around unit economics forms the foundation for sound decision-making. Whether one is building a SaaS company, an AI company, or a hybrid of both, understanding how revenue and costs behave at the most granular level allows management to design operations and financial models that scale intelligently. Without that clarity, growth becomes noise and is not sustainable.
From years of working across SaaS businesses, I have seen firsthand how the model rewards discipline. Predictable recurring revenue, high gross margins, and scalable operating leverage create a compounding effect when managed carefully. The challenge lies in balancing acquisition cost, retention, and cash efficiency, so that each new unit of growth strengthens rather than strains the business.
In AI, the economic story changes. Here, each unit of output incurs tangible costs, such as computation, data, and inference. The path to profitability lies not in volume alone, but in mastering the cost curve. Efficiency, model reuse, and pricing alignment become as critical as sales growth. AI firms must show investors that scaling demand will compress, not inflate, the cost per unit. I have no clue how they intend to do that with GPU demand going through the roof, but in this article, let us assume for giggles that there will be a light at the end of the tunnel, and GPU costs will temper down so it can fuel AI-driven business.
For hybrid SaaS-AI businesses, success depends on integration. AI should deepen customer value, expand lifetime revenue, and justify incremental costs. CFOs and CEOs must manage dual revenue streams, measure blended margins, and communicate transparently with investors about both the promise and the trade-offs of AI adoption.
Ultimately, understanding economics is knowing the truth. I am an economist, and I like to think I am unbiased. It enables leaders to align ambition with reality and design financial models that convey a credible narrative. As the lines between SaaS and AI continue to blur, those who understand the economics underlying innovation will be best equipped to build companies that endure.

How Strategic CFOs Drive Sustainable Growth and Change
When people ask me what the most critical relationship in a company really is, I always say it’s the one between the CEO and the CFO. And no, I am not being flippant. In my thirty years helping companies manage growth, navigate crises, and execute strategic shifts, the moments that most often determine success or spiraled failure often rests on how tightly the CEO and CFO operate together. One sets a vision. The other turns aspiration into action. Alone, each has influence; together, they can transform the business.
Transformation, after all, is not a project. It is a culture shift, a strategic pivot, a redefinition of operating behaviors. It’s more art than engineering and more people than process. And at the heart of it lies a fundamental tension: You need ambition, yet you must manage risk. You need speed, but you cannot abandon discipline. You must pursue new business models while preserving your legacy foundations. In short, you need to build simultaneously on forward momentum and backward certainty.
That complexity is where the strategic CFO becomes indispensable. The CFO’s job is not just to count beans, it’s to clear the ground where new plants can grow. To unlock capital without unleashing chaos. To balance accountable rigor with growth ambition. To design transformation from the numbers up, not just hammer it into the planning cycle. When this role is fulfilled, the CEO finds their most trusted confidante, collaborator, and catalyst.
Think of it this way. A CEO paints a vision: We must double revenue, globalize our go-to-market, pivot into new verticals, revamp the product, or embrace digital. It sounds exciting. It feels bold. But without a financial foundation, it becomes delusional. Does the company have the cash runway? Can the old cost base support the new trajectory? Are incentives aligned? Are the systems ready? Will the board nod or push back? Who is accountable if sales forecast misses or an integration falters? A CFO’s strategic role is to bring those questions forward not cynically, but constructively—so the ambition becomes executable.

The best CEOs I’ve worked with know this partnership instinctively. They build strategy as much with the CFO as with the head of product or sales. They reward honest challenge, not blind consensus. They request dashboards that update daily, not glossy decks that live in PowerPoint. They ask, “What happens to operating income if adoption slows? Can we reverse full-time hiring if needed? Which assumptions unlock upside with minimal downside?” Then they listen. And change. That’s how transformation becomes durable.
Let me share a story. A leader I admire embarked on a bold plan: triple revenue in two years through international expansion and a new channel model. The exec team loved the ambition. Investors cheered. But the CFO, without hesitation, did not say no. She said let us break it down. Suppose it costs $30 million to build international operations, $12 million to fund channel enablement, plus incremental headcount, marketing expenses, R&D coordination, and overhead. Let us stress test the plan. What if licensing stalls? What if fulfillment issues delay launches? What if cross-border tax burdens permanently drag down the margin?
The CEO wanted the bold headline number. But together, they translated it into executable modules. They set up rolling gates: a $5 million pilot, learn, fund next $10 million, learn, and so on. They built exit clauses. They aligned incentives so teams could pivot without losing credibility. They also built redundancy into systems and analytics, with daily data and optionality-based budgeting. The CEO had the vision, but the CFO gave it a frame. That is partnership.
That framing role extends beyond capital structure or P&L. It bleeds into operating rhythm. The strategic CFO becomes the architect of transformation cadence. They design how weekly, monthly, and quarterly look and feel. They align incentive schemes so that geography may outperform globally while still holding central teams accountable. They align finance, people, product, and GTM teams to shared performance metrics—not top-level vanity metrics, but actionable ones: user engagement, cost per new customer, onboarding latency, support burden, renewal velocity. They ensure data is not stashed in silos. They make it usable, trusted, visible. Because transformation is only as effective as your ability to measure missteps, iterate, and learn.
This is why I say the CFO becomes a strategic weapon: a lever for insight, integration, and investment.
Boards understand this too, especially when it is too late. They see CEOs who talk of digital transformation while still approving global headcount hikes. They see operating legacy systems still dragging FY ‘Digital 2.0’ ambition. They see growth funded, but debt rising with little structural benefit. In those moments, they turn to the CFO. The board does not ask the CFO if they can deliver the numbers. They ask whether the CEO can. They ask, “What’s the downside exposure? What are the guardrails? Who is accountable? How long will transformation slow profitability? And can we reverse if needed?”
That board confidence, when positive, is not accidental. It comes from a CFO who built that trust, not by polishing a spreadsheet, but by building strategy together, testing assumptions early, and designing transformation as a financial system.
Indeed, transformation without control is just creative destruction. And while disruption may be trendy, few businesses survive without solid footing. The CFO ensures that disruption does not become destruction. That investments scale with impact. That flexibility is funded. That culture is not ignored. That when exceptions arise, they do not unravel behaviors, but refocus teams.
This is often unseen. Because finance is a support function, not a front-facing one. But consider this: it is finance that approves the first contract. Finance assists in setting the commission structure that defines behavior. Finance sets the credit policy, capital constraints, and invoice timing, and all of these have strategic logic. A CFO who treats each as a tactical lever becomes the heart of transformation.
Take forecasting. Transformation cannot run on backward-moving averages. Yet too many companies rely on year-over-year rates, lagged signals, and static targets. The strategic CFO resurrects forecasting. They bring forward leading indicators of product usage, sales pipeline, supply chain velocity. They reframe forecasts as living systems. We see a dip? We call a pivot meeting. We see high churn? We call the product team. We see hiring cost creep? We call HR. Forewarned is forearmed. That is transformation in flight.
On the capital front, the CFO becomes a barbell strategist. They pair patient growth funding with disciplined structure. They build in fields of optionality: reserves for opportunistic moves, caps on unfunded headcount, staged deployment, and scalable contracts. They calibrate pricing experiments. They design customer acquisition levers with off ramps. They ensure that at every step of change, you can set a gear to reverse—without losing momentum, but with discipline.
And they align people. Transformation hinges on mindset. In fast-moving companies, people often move faster than they think. Great leaders know this. The strategic CFO builds transparency into compensation. They design equity vesting tied to transformation metrics. They design long-term incentives around cross-functional execution. They also design local authority within discipline. Give leaders autonomy, but align them to the rhythm of finance. Even the best strategy dies when every decision is a global approval. Optionality must scale with coordination.
Risk management transforms too. In the past, the CFO’s role in transformation was to shield operations from political turbulence. Today, it is to internally amplify controlled disruption. That means modeling volatility with confidence. Scenario modeling under market shock, regulatory shift, customer segmentation drift. Not just building firewalls, but designing escape ramps and counterweights. A transformation CFO builds risk into transformation—but as a system constraint to be managed, not a gate to prevent ambition.
I once had a CEO tell me they felt alone when delivering digital transformation. HR was not aligned. Product was moving too slowly. Sales was pushing legacy business harder. The CFO had built a bridge. They brought HR, legal, sales, and marketing into weekly update sessions, each with agreed metrics. They brokered resolutions. They surfaced trade-offs confidently. They pressed accountability floor—not blame, but clarity. That is partnership. That is transformation armor.
Transformation also triggers cultural tectonics. And every tectonic shift features friction zones—power renegotiation, process realignment, work redesign. Without financial discipline, politics wins. Mistrust builds. Change derails. The strategic CFO intervenes not as a policeman, but as an arbiter of fairness: If people are asked to stretch, show them the ROI. If processes migrate, show them the rationale. If roles shift, unpack the logic. Maintaining trust alignment during transformation is as important as securing funding.
The ability to align culture, capital, cadence, and accountability around a single north star—that is the strategic CFO’s domain.
And there is another hidden benefit: the CFO’s posture sets the tone for transformation maturity. CFOs who co-create, co-own, and co-pivot build transformation muscle. Those companies that learn together scale transformation together.
I once wrote that investors will forgive a miss if the learning loops are obvious. That is also true inside the company. When a CEO and CFO are aligned, and the CFO is the first to acknowledge what is not working to expectations, when pivots are driven by data rather than ego, that establishes the foundation for resilient leadership. That is how companies rebuild trust in growth every quarter. That is how transformation becomes a norm.
If there is a fear inside the CFO community, it is the fear of being visible. A CFO may believe that financial success is best served quietly. But the moment they step confidently into transformation, they change that dynamic. They say: Yes, we own the books. But we also own the roadmap. Yes, we manage the tail risk. But we also amplify the tail opportunity. That mindset is contagious. It builds confidence across the company and among investors. That shift in posture is more valuable than any forecast.
So let me say it again. Strategy is not a plan. Mechanics do not make execution. Systems do. And at the junction of vision and execution, between boardroom and frontline, stands the CFO. When transformation is on the table, the CFO walks that table from end to end. They make sure the chairs are aligned. The evidence is available. The accountability is shared. The capital is allocated, measured, and adapted.
This is why I refer to the CFO as the CEO’s most important ally. Not simply a confidante. Not just a number-cruncher. A partner in purpose. A designer of execution. A steward of transformation. Which is why, if you are a CFO reading this, I encourage you: step forward. You do not need permission to rethink transformation. You need conviction to shape it. And if you can build clarity around capital, establish a cadence for metrics, align incentives, and implement systems for governance, you will make your CEO’s job easier. You will elevate your entire company. You will unlock optionality not just for tomorrow, but for the years that follow. Because in the end, true transformation is not a moment. It is a movement. And the CFO, when prepared, can lead it.

The Power of Customer Lifetime Value in Modern Business
In contemporary business discourse, few metrics carry the strategic weight of Customer Lifetime Value (CLV). CLV and CAC are prime metrics. For modern enterprises navigating an era defined by digital acceleration, subscription economies, and relentless competition, CLV represents a unifying force, uniting finance, marketing, and strategy into a single metric that measures not only transactions but also the value of relationships. Far more than a spreadsheet calculation, CLV crystallizes lifetime revenue, loyalty, referral impact, and long-term financial performance into a quantifiable asset.
This article explores CLV’s origins, its mathematical foundations, its role as a strategic North Star across organizational functions, and the practical systems required to integrate it fully into corporate culture and capital allocation. It also highlights potential pitfalls and ethical implications.
I. CLV as a Cross-Functional Metric
CLV evolved from a simple acknowledgement: not all customers are equally valuable, and many businesses would prosper more by nurturing relationships than chasing clicks. The transition from single-sale tallies to lifetime relationship value gained momentum with the rise of subscription models—telecom plans, SaaS platforms, and membership programs—where the fiscal significance of recurring revenue became unmistakable.
This shift reframed capital deployment and decision-making:
- Marketing no longer seeks volume unquestioningly but targets segments with high long-term value.
- Finance integrates CLV into valuation models and capital allocation frameworks.
- Strategy uses it to guide M&A decisions, pricing stratagems, and product roadmap prioritization.
Because CLV is simultaneously a financial measurement and a customer-centric tool, it builds bridges—translating marketing activation into board-level impact.
II. How to calculate CLV
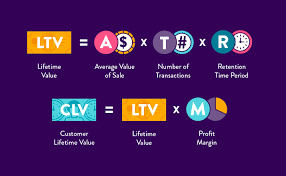
At its core, CLV employs economic modeling similar to net present value. A basic formula:
CLV = ∑ (t=0 to T) [(Rt – Ct) / (1 + d)^t]
- Rt = revenue generated at time t
- Ct = cost to serve/acquire at time t
- d = discount rate
- T = time horizon
This anchors CLV in well-accepted financial principles: discounted future cash flows, cost allocation, and multi-period forecasting. It satisfies CFO requirements for rigor and measurability.
However, marketing leaders often expand this to capture:
- Referral value (Rt includes not just direct sales, but influenced purchases)
- Emotional or brand-lift dimensions (e.g., window customers who convert later)
- Upselling, cross-selling, and tiered monetization over time
These expansions refine CLV into a dynamic forecast rather than a static average—one that responds to segmentation and behavioral triggers.
III. CLV as a Board-Level Metric
A. Investment and Capital Prioritization
Traditional capital decisions rely on ROI, return on invested capital (ROIC), and earnings multiples. CLV adds nuance: it gauges not only immediate returns but extended client relationships. This enables an expanded view of capital returns.
For example, a company might shift budget from low-CLV acquisition channels to retention-focused strategies—investing more in on-boarding, product experience, or customer success. These initiatives, once considered costs, now become yield-generating assets.
B. Segment-Based Acquisition
CLV enables precision targeting. A segment that delivers a 6:1 lifetime value-to-acquisition-cost (LTV:CAC) ratio is clearly more valuable than one delivering 2:1. Marketing reallocates spend accordingly, optimizing strategic segmentation and media mix, tuning messaging for high-value cohorts.
Because CLV is quantifiable and forward-looking, it naturally aligns marketing decisions with shareholder-driven metrics.
C. Tiered Pricing and Customer Monetization
CLV is also central to monetization strategy. Churn, upgrade rates, renewal behaviors, and pricing power all can be evaluated through the lens of customer value over time. Versioning, premium tiers, loyalty benefits—all become levers to maximize lifetime value. Finance and strategy teams model these scenarios to identify combinations that yield optimal returns.
D. Strategic Partnerships and M&A
CLV informs deeper decisions about partnerships and mergers. In evaluating a potential platform acquisition, projected contribution to overall CLV may be a decisive factor, especially when combined customer pools or cross-sell ecosystems can amplify lifetime revenue. It embeds customer value insights into due diligence and valuation calculations.
IV. Organizational Integration: A Strategic Imperative
Effective CLV deployment requires more than good analytics—it demands structural clarity and cultural alignment across three key functions.
A. Finance as Architect
Finance teams frame the assumptions—discount rates, cost allocation, margin calibration—and embed CLV into broader financial planning and analysis. Their task: convert behavioral data and modeling into company-wide decision frameworks used in investment reviews, budgeting, and forecasting processes.
B. Marketing as Activation Engine
Marketing owns customer acquisition, retention campaigns, referral programs, and product messaging. Their role is to feed the CLV model with real data: conversion rates, churn, promotion impact, and engagement flows. In doing so, campaigns become precision tools tuned to maximize customer yield rather than volume alone.
C. Strategy as Systems Designer
The strategy team weaves CLV outputs into product roadmaps, pricing strategy, partnership design, and geographic expansion. Using CLV foliated by cohort and channel, strategy leaders can sequence investments to align with long-term margin objectives—such as a five-year CLV-driven revenue mix.
V. Embedding CLV Into Corporate Processes
The following five practices have proven effective at embedding CLV into organizational DNA:
- Executive Dashboards
Incorporate LTV:CAC ratios, cohort retention rates, and segment CLV curves into executive reporting cycles. Tie leadership incentives (e.g., bonuses, compensation targets) to long-term value outcomes. - Cross-Functional CLV Cells
Establish CLV analytics teams staffed by finance, marketing insights, and data engineers. They own CLV modeling, simulation, and distribution across functions. - Monthly CLV Reviews
Monthly orchestration meetings integrate metrics updates, marketing feedback on campaigns, pricing evolution, and retention efforts. Simultaneous adjustment across functions allows dynamic resource allocation. - Capital Allocation Gateways
Projects involving customer-facing decisions—from new products to geographic pullbacks—must include CLV impact assessments in gating criteria. These can also feed into product investment requests and ROI thresholds. - Continuous Learning Loops
CLV models must be updated with actual lifecycle data. Regular recalibration fosters learning from retention behaviors, pricing experiments, churn drivers, and renewal rates—fueling confidence in incremental decision-making.
VI. Caveats and Limitations
CLV, though powerful, is not a cure-all. These caveats merit attention:
- Data Quality: Poorly integrated systems, missing customer identifiers, or inconsistent cohort logic can produce misleading CLV metrics.
- Assumption Risk: Discount rates, churn decay, turnaround behavior—all are model assumptions. Unqualified confidence can mislead investment.
- Narrow Focus: High CLV may chronically favor established segments, leaving growth through new markets or products underserved.
- Over-Targeting Risk: Over-optimizing for short-term yield may harm brand reputation or equity with broader audiences.
Therefore, CLV must be treated with humility—an advanced tool requiring discipline in measurement, calibration, and multi-dimensional insight.
VII. The Influence of Digital Ecosystems
Modern digital ecosystems deliver immense granularity. Every interaction—click, open, referral, session length—is measurable. These dark data provide context for CLV testing, segment behavior, and risk triggers.
However, this scale introduces overfitting risk: spurious correlations may override structural signals. Successful organizations maintain a balance—leveraging high-frequency signals for short-cycle interventions, while retaining medium-term cohort logic for capital allocation and strategic initiatives.
VIII. Ethical and Brand Implications
“CLV”, when viewed through a values lens, also becomes a cultural and ethical marker. Decisions informed by CLV raise questions:
- To what extent should a business monetize a cohort? Is excessive monetization ethical?
- When loyalty programs disproportionately reward high-value customers, does brand equity suffer among moderate spenders?
- When referral bonuses attract opportunists rather than advocates, is brand authenticity compromised?
These considerations demand that CLV strategies incorporate brand and ethical governance, not just financial optimization.
IX. Cross-Functionally Harmonized Governance
A robust operating model to sustain CLV alignment should include:
- Structured Metrics Governance: Common cohort definitions, discount rates, margin allocation, and data timelines maintained under joint sponsorship.
- Integrated Information Architecture: Real-time reporting, defined data lineage (acquisition to LTV), and cross-functional access.
- Quarterly Board Oversight: Board-level dashboards that track digital customer performance and CLV trends as fundamental risk and opportunity signals.
- Ethical Oversight Layer: Cross-functional reviews ensuring CLV-driven decisions don’t undermine customer trust or brand perception.
X. CLV as Strategic Doctrine
When deployed with discipline, CLV becomes more than a metric—it becomes a cultural doctrine. The essential tenets are:
- Time horizon focus: orienting decisions toward lifetime impact rather than short-cycle transactions.
- Cross-functional governance: embedding CLV into finance, marketing, and strategy with shared accountability.
- Continuous recalibration: creating feedback loops that update assumptions and reinforce trust in the metric.
- Ethical stewardship: ensuring customer relationships are respected, brand equity maintained, and monetization balanced.
With that foundation, CLV can guide everything from media budgets and pricing plans to acquisition strategy and market expansion.
Conclusion
In an age where customer relationships define both resilience and revenue, Customer Lifetime Value stands out as an indispensable compass. It unites finance’s need for systematic rigor, marketing’s drive for relevance and engagement, and strategy’s mandate for long-term value creation. When properly modeled, governed, and governed ethically, CLV enables teams to shift from transactional quarterly mindsets to lifetime portfolios—transforming customers into true franchise assets.
For any organization aspiring to mature its performance, CLV is the next frontier. Not just a metric on a dashboard—but a strategic mechanism capable of aligning functions, informing capital allocation, shaping product trajectories, elevating brand meaning, and forging relationships that transcend a single transaction.
Term Sheets: Landmines and Ticking Time Bombs!
Wall Street is the only place that people ride to in a Rolls Royce to get advice from those who take the subway. – Warren Buffett

So the big day is here. You have evangelized your product across various circles and the good news is that a VC has stepped forward to invest in your company. So the hard work is all done! You can rest on your laurels, sign the term sheet that the VC has pushed across the table, and execute the sheet, trigger the stock purchase, voter and investor rights agreements, get the wire and you are up and running! Wait … sounds too good to be true, doesn’t it? And yes you are right! If only things were that easy. The devil is in the details. So let us go over some of the details that you need to watch out for.
1. First, term sheet does not trigger the wire. Signing a term sheet does not mean that the VC will invest in your company. The road is still long and treacherous. All the term sheet does is that it requires you to keep silent on the negotiations, and may even prevent you to shop the deal to anyone else. The key investment terms are laid out in the sheet and would be used in much greater detail when the stock purchase agreement, the investor rights agreement, the voting agreement and other documents are crafted.
 2. Make sure that you have an attorney representing you. And more importantly, an attorney that has experience in the field and has reviewed a lot of such documents. As noted, the devil is in the details. A little “and” or “or” can put you back significantly. But it is just as important for you to know some of the key elements that govern an investment agreement. You can quiz your attorney on these because some of these are important enough to impact your operating degree of freedom in the company.The starting point of a term sheet is valuation of the company. You will hear the concept of pre-money valuation vs. post-money valuation. It is quite simple. The Pre-Money Valuation + Investment = Post-Money Valuation. In other words, Pre-money valuation refers to the value of a company not including external funding or the latest round of funding. Post-Money thus includes the pre-money plus the incremental injection of capital. Let us look at an example:
Let’s explain the difference by using an example. Suppose that an investor is looking to invest in a start up. Both parties agree that the company is worth $1 million and the investor will put in $250,000.
The ownership percentages will depend on whether this is a $1 million pre-money or post-money valuation. If the $1 million valuation is pre-money, the company is valued at $1 million before the investment and after investment will be valued at $1.25 million. If the $1 million valuation takes into consideration the $250,000 investment, it is referred to as post-money. Thus in a pre-money valuation, the Investor owns 20%. Why? The total valuation is $1.25M which is $1M pre-money + $250K capital. So the math translates to $250K/$1,250K = 20%. If the investor says that they will value company $1M post-money, what they are saying is that they are actually giving you a pre-money valuation of $750K. In other words, they will own 25% of the company rather than 20%. Your ownership rights go down by 5% which, for all intents and purposes, is significant.
3. When a round of financing is done, security is exchanged in lieu of cash received. You already have common stock but these are not the securities being exchanged. The company would issue preferred stock. Preferred stock comes with certain rights, preferences, privileges and covenants. Compared to common stock, it is a superior security. There are a number of important rights and privileges that investors secure via a preferred stock purchase, including a right to a board seat, information rights, a right to participate in future rounds to protect their ownership percentage (called a pro-rata right), a right to purchase any common stock that might come onto the market (called a right of first refusal), a right to participate alongside any common stock that might get sold (called a co-sale right), and an adjustment in the purchase price to reflect sales of stock at lower prices (called an anti-dilution right). Let us examine this in greater detail now. There are two types of preferred. The regular vanilla Convertible Preferred and the Participating Preferred. As the latter name suggests, the Participating Preferred allows the VC to receive back their invested capital and the cumulative dividends, if any before common stockholders (that is you), but also enables them to participate on an as-converted basis in the returns to you, the common stockholder. Here is the math:Let us say company raises $3M at a $3M pre-money valuation. As mentioned before in point (3), the stake is 50%-50% owner-investor.
Let us say company sells for $25M. Now the investor has participating preferred or convertible preferred. How does the difference impact you, the stockholder or the founder. Here goes!
i. Participating Preferred. Investor gets their $3M back. There is still $22M left in the coffers. Investor splits 50-50 based on their participating preferred. You and Investor both take home $11M from the residual pool. Investor has $14M, and you have $11M. Congrats!
ii. Convertible Preferred. Investor gets 50% or $12.5M and you get the same – $12.5M. In other words, convertible preferred just got you a few more drinks at the bar. Hearty Congratulations!
Bear in mind that if the Exit Value is lower, the difference becomes more meaningful. Let us say exit was $10M. The Preferred participant gets $3M + $3.5M = $6.5M while you end up with $3.5M.
 4. One of the key provisions is Liquidation Preferences. It can be a ticking time bomb. Careful! Some investors may sometimes ask for a multiple of their investment as a preference. This provision provides downside protection to investors. In the event of liquidation, the company has to pay back the capital injected for preferred. This would mean a 1X liquidation preference. However, you can have a 2X liquidation preference which means the investor will get back twice as much as what they injected. Most liquidation preferences range from 1X to 2X, although you can have higher liquidation preference multiples as well. However, bear in mind that this becomes important only when the company is forced to liquidate and sell of their assets. If all is gung-ho, this is a silent clause and no sweat off your brow.
5. Redemption rights. The right of redemption is the right to demand under certain conditions that the company buys back its own shares from its investors at a fixed price. This right may be included to require a company to buy back its shares if there has not been an exit within a pre-determined period. Failure to redeem shares when requested might result in the investors gaining improved rights, such as enhanced voting rights.
6. The terms could demand that a certain option pool or a pot of stock is kept aside for existing and future employees, or other service providers. It could be a range anywhere between 10-20% of the total stock. When you reserve this pool, you are cutting into your ownership stake. In those instances when you have series of financings and each financing requires you to set aside a small pool, it dilutes you and your previous investors. In general, the way these pools are structured is to give you some headroom up to at least 24 months to accommodate employee growth and providing them incentives. The pool only becomes smaller with the passage of time.
7. Another term is the Anti-Dilution Provision. In its simplest form, anti-dilution rights are a zero- sum game. No one has an advantage over the other. However, this becomes important only when there is a down round. A down round basically means that the company is valued lower in subsequent financing than previously. A company valued at $25M in Series A and $15M in Series B – the Series B would be considered a down round. Two Types of Anti-Dilution:
Full ratchet Anti-Dilution: If the new stock is priced lower than prior stock, the early investor has a clause to convert their shares to the new price. For example, if prior investor paid $1.00 and then it was reset in a later round to $0.50, then the prior investors will have 2X rights to common stock. In other words, you are hit with major dilution as are the later investors. This clause is a big hurdle for new investors.
Weighted Average Anti-Dilution. Old investor’s share is adjusted in proportion to the dilution impact of a down round
8. Pay to Play. These are clauses that work in your, the Company, favor. Basically, investors have to invest some money in later financings, and if they do not – their rights may be reduced. However, having these clauses may put your mind at ease, but may create problems in terms of syndicating or getting investments. Some investors are reluctant to put their money in when there are pay to play clauses in the agreement.
9. Right of First Refusal. A company has no obligation to sell stock in future financing rounds to existing investors. Some investors would like to participate and may seek pro-rata participating to keep their ownership stake the same post-financing. Some investors may even want super pro-rata rights which means that they be allowed to participate to such an extent that their new ownership in the company is greater than their previous ownership stake.
10. Board of Directors. A large board creates complexity. Preferable to have a small but strategic board. New investors will require some representation. If too many investors request representation, the Company may have smaller internal representatives and may be outvoted on certain issues. Be aware of the dynamics of a mushrooming board!
11.Voting Rights. Investors may request certain veto authority or have rights to vote in favor of or against a corporate initiative. Company founders may want super-voting rights to exercise greater control. These matters are delicate and going one way or the other may cause personal issues among the participants. However, these matters can be easily resolved by essentially having carve-outs that spell out rights and encumbrances.
12.Drag Along Provision. Might create an obligation on all shareholders of the company to sell their shares to a potential purchaser if a certain percentage of the shareholders (or of a specific class of shareholders) votes to sell to that purchaser. Often in early rounds drag along rights can only be enforced with the consent of those holding at least a majority of the shares held by investors. These rights can be useful in the context of a sale where potential purchasers will want to acquire 100% of the shares of the company in order to avoid having responsibilities to minority shareholders after the acquisition. Many jurisdictions provide for such a process, usually when a third party has acquired at least 90% of the shares.
13.Representations and Warranties. Venture capital investors expect appropriate representations and warranties to be provided by key founders, management and the company. The primary purpose of the representations and warranties is to provide the investors with a complete and accurate understanding of the current condition of the company and its past history so that the investors can evaluate the risks of investing in the company prior to subscribing for their shares. The representations and warranties will typically cover areas such as the legal existence of the company (including all share capital details), the company’s financial statements, the business plan, asset ownership (in particular intellectual property rights), liabilities (contingent or otherwise), material contracts, employees and litigation. It is very rare that a company is in a perfect state. The warrantors have the opportunity to set out issues which ought to be brought to the attention of the new investors through a disclosure letter or schedule of exceptions. This is usually provided by the warrantors and discloses detailed information concerning any exceptions to or carve-outs from the representations and warranties. If a matter is referred to in the disclosure letter the investors are deemed to have notice of it and will not be able to claim for breach of warranty in respect of that matter. Investors expect those providing representations and warranties about the company to reimburse the investors for the diminution in share value attributable to the representations and warranties being inaccurate or if there are exceptions to them that have not been fully disclosed. There are usually limits to the exposure of the warrantors (i.e. a dollar cap on the amount that can be recovered from individual warrantors). These are matters for negotiation when documentation is being finalized. The limits may vary according to the severity of the breach, the size of the investment and the financial resources of the warrantors. The limits which typically apply to founders are lower than for the company itself (where the company limit will typically be the sum invested or that sum plus a minimum return).
14. Information Rights. In order for venture capital investors to monitor the condition of their investment, it is essential that the company provides them with certain regular updates concerning its financial condition and budgets, as well as a general right to visit the company and examine its books and records. This sometimes includes direct access to the company’s auditors and bankers. These contractually defined obligations typically include timely transmittal of annual financial statements (including audit requirements, if applicable), annual budgets, and audited monthly and quarterly financial statements.
15. Exit. Venture capital investors want to see a path from their investment in the company leading to an exit, most often in the form of a disposal of their shares following an IPO or by participating in a sale. Sometimes the threshold for a liquidity event or will be a qualified exit. If used, it will mean that a liquidity event will only occur, and conversion of preferred shares will only be compulsory, if an IPO falls within the definition of a qualified exit. A qualified exit is usually defined as a sale or IPO on a recognized investment exchange which, in either case, is of a certain value to ensure the investors get a minimum return on their investment. Consequently, investors usually require undertakings from the company and other shareholders that they will endeavor to achieve an appropriate share listing or trade sale within a limited period of time (typically anywhere between 3 and 7 years depending on the stage of investment and the maturity of the company). If such an exit is not achieved, investors often build in structures which will allow them to withdraw some or the entire amount of their investment.
16. Non-Compete, Confidentiality Agreements. It is good practice for any company to have certain types of agreements in place with its employees. For technology start-ups, these generally include Confidentiality Agreements (to protect against loss of company trade secrets, know-how, customer lists, and other potentially sensitive information), Intellectual Property Assignment Agreements (to ensure that intellectual property developed by academic institutions or by employees before they were employed by the company will belong to the company) and Employment Contracts or Consultancy Agreements (which will include provisions to ensure that all intellectual property developed by a company’s employees belongs to the company). Where the company is a spin-out from an academic institution, the founders will frequently be consultants of the company and continue to be employees of the academic institution, at least until the company is more established. Investors also seek to have key founders and managers enter into Non-compete Agreements with the company. In most cases, the investment in the company is based largely on the value of the technology and management experience of the management team and founders. If they were to leave the company to create or work for a competitor, this could significantly affect the company’s value. Investors normally require that these agreements be included in the Investment Agreement as well as in the Employment/Consultancy Agreements with the founders and senior managers, to enable them to have a right of direct action against the founders’ and managers if the restrictions are breached.
Disseminating financial knowledge to develop engaged organizations
Financial awareness of key drivers are becoming the paramount leading indicators for organizational success. For most, the finance department is a corner office service that offers ad hoc analysis on strategic and operational initiatives to a company, and provides an ex-post assessment of the financial condition of the company among a select few. There are some key financial metrics that one wants to measure across all companies and all industries without exception, but then there are unique metrics that reflect the key underlying drivers for organizational success. Organizations align their forays into new markets, new strategies and new ventures around a narrative that culminates in a financial metric or a proxy that illustrates opportunities lost or gained.
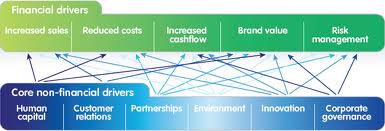
Having been cast in operational finance roles for a good length of my career, I have often encountered a high level of interest to learn financial concepts in areas such as engineering, product management, operations, sales, etc. I have to admit that I have been humbled by the fairly wide common-sense understanding of basic financial concepts that these folks have. However, in most cases, the understanding is less than skin deep with misunderstandings that are meaningful. The good news is that I have also noticed a promising trend, namely … the questions are more thoroughly weighed by the “non-finance” participants, and there seems to be an elevated understanding of key financial drivers that translate to commercial success. This knowledge continues to accelerate … largely, because of convergence of areas around data science, analytics, assessment of personal ownership stakes, etc. But the passing of such information across these channels to the hungry recipients are not formalized. In other words, I posit that having a formal channel of inculcating financial education across the various functional areas would pay rich dividends for the company in the long run. Finance is a vast enough field that partaking general knowledge in these concepts which are more than merely skin-deep would also enable the finance group to engage in meaningful conversations with other functional experts, thus allowing the narrative around the numbers to be more wholesome. Thus, imparting the financial knowledge would be beneficial to the finance department as well.

To be effective in creating a formal channel of disseminating information of the key areas in finance that matter to the organization, it is important to understand the operational drivers. When I say operational drivers, I am expanding that to encompass drivers that may uniquely affect other functional areas. For example, sales may be concerned with revenue, margins whereas production may be concerned with server capacity, work-in-process and throughput, etc. At the end, the financial metrics are derivatives. They are cross products of single or multiple drivers and these are the elements that need to be fleshed out to effect a spirited conversation. That would then enable the production of a financial barometer that everyone in the organization can rally behind and understand, and more importantly … be able to assess how their individual contribution has and will advance organization goals.
The Big Data Movement: Importance and Relevance today?
We are entering into a new age wherein we are interested in picking up a finer understanding of relationships between businesses and customers, organizations and employees, products and how they are being used, how different aspects of the business and the organizations connect to produce meaningful and actionable relevant information, etc. We are seeing a lot of data, and the old tools to manage, process and gather insights from the data like spreadsheets, SQL databases, etc., are not scalable to current needs. Thus, Big Data is becoming a framework to approach how to process, store and cope with the reams of data that is being collected.

According to IDC, it is imperative that organizations and IT leaders focus on the ever-increasing volume, variety and velocity of information that forms big data.
- Volume. Many factors contribute to the increase in data volume – transaction-based data stored through the years, text data constantly streaming in from social media, increasing amounts of sensor data being collected, etc. In the past, excessive data volume created a storage issue. But with today’s decreasing storage costs, other issues emerge, including how to determine relevance amidst the large volumes of data and how to create value from data that is relevant.
- Variety. Data today comes in all types of formats – from traditional databases to hierarchical data stores created by end users and OLAP systems, to text documents, email, meter-collected data, video, audio, stock ticker data and financial transactions. By some estimates, 80 percent of an organization’s data is not numeric! But it still must be included in analyses and decision making.
- Velocity. According to Gartner, velocity “means both how fast data is being produced and how fast the data must be processed to meet demand.” RFID tags and smart metering are driving an increasing need to deal with torrents of data in near-real time. Reacting quickly enough to deal with velocity is a challenge to most organizations.
SAS has added two additional dimensions:
- Variability. In addition to the increasing velocities and varieties of data, data flows can be highly inconsistent with periodic peaks. Is something big trending in the social media? Daily, seasonal and event-triggered peak data loads can be challenging to manage – especially with social media involved.
- Complexity. When you deal with huge volumes of data, it comes from multiple sources. It is quite an undertaking to link, match, cleanse and transform data across systems. However, it is necessary to connect and correlate relationships, hierarchies and multiple data linkages or your data can quickly spiral out of control. Data governance can help you determine how disparate data relates to common definitions and how to systematically integrate structured and unstructured data assets to produce high-quality information that is useful, appropriate and up-to-date.

So to reiterate, Big Data is a framework stemming from the realization that the data has gathered significant pace and that it’s growth has exceeded the capacity for an organization to handle, store and analyze the data in a manner that offers meaningful insights into the relationships between data points. I am calling this a framework, unlike other materials that call Big Data a consequent of the inability of organizations to handle mass amounts of data. I refer to Big Data as a framework because it sets the parameters around an organizations’ decision as to when and which tools must be deployed to address the data scalability issues.

Thus to put the appropriate parameters around when an organization must consider Big Data as part of their analytics roadmap in order to understand the patterns of data better, they have to answer the following ten questions:
- What are the different types of data that should be gathered?
- What are the mechanisms that have to be deployed to gather the relevant data?
- How should the data be processed, transformed and stored?
- How do we ensure that there is no single point of failure in data storage and data loss that may compromise data integrity?
- What are the models that have to be used to analyze the data?
- How are the findings of the data to be distributed to relevant parties?
- How do we assure the security of the data that will be distributed?
- What mechanisms do we create to implement feedback against the data to preserve data integrity?
- How do we morph the big data model into new forms that accounts for new patterns to reflect what is meaningful and actionable?
- How do we create a learning path for the big data model framework?
Some of the existing literature have commingled Big Data framework with analytics. In fact, the literature has gone on to make a rather assertive statement i.e. that Big Data and predictive analytics be looked upon in the same vein. Nothing could be further from the truth!
There are several tools available in the market to do predictive analytics against a set of data that may not qualify for the Big Data framework. While I was the CFO at Atari, we deployed business intelligence tools using Microstrategy, and Microstrategy had predictive modules. In my recent past, we had explored SAS and Minitab tools to do predictive analytics. In fact, even Excel can do multivariate, ANOVA and regressions analysis and best curve fit analysis. These analytical techniques have been part of the analytics arsenal for a long time. Different data sizes may need different tools to instantiate relevant predictive analysis. This is a very important point because companies that do not have Big Data ought to seriously reconsider their strategy of what tools and frameworks to use to gather insights. I have known companies that have gone the Big Data route, although all data points ( excuse my pun), even after incorporating capacity and forecasts, suggest that alternative tools are more cost-effective than implementing Big Data solutions. Big Data is not a one-size fit-all model. It is an expensive implementation. However, for the right data size which in this case would be very large data size, Big Data implementation would be extremely beneficial and cost effective in terms of the total cost of ownership.
Areas where Big Data Framework can be applied!
Some areas lend themselves to the application of the Big Data Framework. I have identified broadly four key areas:
- Marketing and Sales: Consumer behavior, marketing campaigns, sales pipelines, conversions, marketing funnels and drop-offs, distribution channels are all areas where Big Data can be applied to gather deeper insights.
- Human Resources: Employee engagement, employee hiring, employee retention, organization knowledge base, impact of cross-functional training, reviews, compensation plans are elements that Big Data can surface. After all, generally over 60% of company resources are invested in HR.
- Production and Operational Environments: Data growth, different types of data appended as the business learns about the consumer, concurrent usage patterns, traffic, web analytics are prime examples.
- Financial Planning and Business Operational Analytics: Predictive analytics around bottoms-up sales, marketing campaigns ROI, customer acquisitions costs, earned media and paid media, margins by SKU’s and distribution channels, operational expenses, portfolio evaluation, risk analysis, etc., are some of the examples in this category.
Hadoop: A Small Note!
Hadoop is becoming a more widely accepted tool in addressing Big Data Needs. It was invented by Google so they could index the structural and text information that they were collecting and present meaningful and actionable results to the users quickly. It was further developed by Yahoo that tweaked Hadoop for enterprise applications.
Hadoop runs on a large number of machines that don’t share memory or disks. The Hadoop software runs on each of these machines. Thus, if you have for example – over 10 gigabytes of data – you take that data and spread that across different machines. Hadoop tracks where all these data resides! The servers or machines are called nodes, and the common logical categories around which the data is disseminated are called clusters. Thus each server operates on its own little piece of the data, and then once the data is processed, the results are delivered to the main client as a unified whole. The method of reducing the disparate sources of information residing in various nodes and clusters into one unified whole is the process of MapReduce, an important mechanism of Hadoop. You will also hear something called Hive which is nothing but a data warehouse. This could be a structured or unstructured warehouse upon which the Hadoop works upon, processes data, enables redundancy across the clusters and offers a unified solution through the MapReduce function.

Personally, I have always been interested in Business Intelligence. I have always considered BI as a stepping stone, in the new age, to be a handy tool to truly understand a business and develop financial and operational models that are fairly close to the trending insights that the data generates. So my ear is always to the ground as I follow the developments in this area … and though I have not implemented a Big Data solution, I have always been and will continue to be interested in seeing its applications in certain contexts and against the various use cases in organizations.
Implementing Balanced Scorecard Model for Employee Engagement
The Balanced Scorecard Model (BSC) was introduced by Kaplan & Norton in their book “The Balanced Scorecard” (1996). It is one of the more widely used management tools in large organizations.

One of the major strengths of the BSC model is how the key categories in the BSC model links to corporate missions and objectives. The key categories which are referred to as “perspectives” illustrated in the BSC model are:
Financial Perspective:
Kaplan and Norton do not disregard the traditional need for financial data. Timely and accurate data will always be a priority, and managers will do whatever necessary to provide it. In fact, often there is more than enough handling and processing of financial data. With the implementation of a corporate database, it is hoped that more of the processing can be centralized and automated. But the point is that the current emphasis on financials leads to the “unbalanced” situation with regard to other perspectives. There is perhaps a need to include additional financial-related data, such as risk assessment and cost-benefit data, in this category.
Customer Perspective
Recent management philosophy has shown an increasing realization of the importance of customer focus and customer satisfaction in any business. These are leading indicators: if customers are not satisfied, they will eventually find other suppliers that will meet their needs. Poor performance from this perspective is thus a leading indicator of future decline, even though the current financial picture may look good. In developing metrics for satisfaction, customers should be analyzed in terms of kinds of customers and the kinds of processes for which we are providing a product or service to those customer groups
Internal Business Process Perspective
This perspective refers to internal business processes. Metrics based on this perspective allow the managers to know how well their business is running, and whether its products and services conform to customer requirements (the mission). These metrics have to be carefully designed by those who know these processes most intimately; with our unique missions these are not necessarily something that can be developed by outside consultants. My personal opinion on this matter is that the internal business process perspective is too important and that internal owners or/and teams take ownership of understanding the process.
Learning and Growth Perspective
This perspective includes employee training and corporate cultural attitudes related to both individual and corporate self-improvement. In a knowledge-worker organization, people — the only repository of knowledge — are the main resource. In the current climate of rapid technological change, it is becoming necessary for knowledge workers to be in a continuous learning mode. Metrics can be put into place to guide managers in focusing training funds where they can help the most. In any case, learning and growth constitute the essential foundation for success of any knowledge-worker organization.
Kaplan and Norton emphasize that ‘learning’ is more than ‘training’; it also includes things like mentors and tutors within the organization, as well as that ease of communication among workers, the engagement of the workers, the potential of cross-training that would create pockets of bench strength and switch hitters, and other employee specific programs that allows them to readily get help on a problem when it is needed. It also includes technological tools; what the Baldrige criteria call “high performance work systems.”
Innovation Perspective
This perspective was appended to the above four by Bain and Company. It refers to the vitality of the organization and its culture to provide the appropriate framework to encourage innovation. Organizations have to innovate. Innovation is becoming the key distinctive element in great organizations, and high levels of innovation or innovative thinking are talent magnets.
Taking the perspectives a step further, Kaplan and Cooper instituted measures and targets associated with each of those targets. The measures are geared around what the objective is associated with each of the perspectives rather than a singular granule item. Thus, if the objective is to increase customer retention, an appropriate metric or set of metrics is around how to measure the objective and track success to it than defining a customer.
One of the underlying presumptions in this model is to ensure that the key elements around which objectives are defined are done so at a fairly detailed level and to the extent possible – defined so much so that an item does not have polymorphous connotations. In other words, there is and can be only a single source of truth associated with the key element. That preserves the integrity of the model prior to its application that would lead to the element branching out into a plethora of objectives associated with the element.
Objectives, Measures, Targets and Initiatives
Within each of the Balance Scorecard financial, customer, internal process, learning perspectives and innovation perspectives, the firm must define the following:
Strategic Objectives – what the strategy is to achieve in that perspective
Measures – how progress for that particular objective will be measured
Targets – the target value sought for each measure
Initiatives – what will be done to facilitate the reaching of the target?

As in models and analytics, the information that the model spouts could be rife with a cascade of metrics. Metrics are important but too many metrics associated with the perspectives may diffuse the ultimate end that the perspectives represent.
Hence, one has to exercise restraint and rigor in defining a few key metrics that are most relevant and roll up to corporate objectives. As an example, outlined below are examples of metrics associated with the perspectives:
Financial performance (revenues, earnings, return on capital, cash flow);
Customer value performance (market share, customer satisfaction measures, customer loyalty);
Internal business process performance (productivity rates, quality measures, timeliness);
Employee performance (morale, knowledge, turnover, use of best demonstrated practices);
Innovation performance (percent of revenue from new products, employee suggestions, rate of improvement index);

To construct and implement a Balanced Scorecard, managers should:
- Articulate the business’s vision and strategy;
- Identify the performance categories that best link the business’s vision and strategy to its results (e.g., financial performance, operations, innovation, and employee performance);
- Establish objectives that support the business’s vision and strategy;
- Develop effective measures and meaningful standards, establishing both short-term milestones and long-term targets;
- Ensure company wide acceptance of the measures;
- Create appropriate budgeting, tracking, communication, and reward systems;
- Collect and analyze performance data and compare actual results with desired performance;
- Take action to close unfavorable gaps.
The link above contains a number of templates and examples that you may find helpful.

I have discussed organization architecture and employee engagement in our previous blogs. The BSC is a tool to encourage engagement while ensuring a tight architecture to further organizational goals. You may forget that as an employee, you occupy an important place in the ecosystem; the forgetting does not speak to your disenchantment toward the job, neither to your disinclination toward the uber-goals of the organization. The forgetting really speaks to potentially a lack of credible leadership that has not taken the appropriate efforts to engage the organization by pushing this structure that forces transparency. The BSC is one such articulate model that could be used, even at its crudest form factor, to get employees informed and engaged.
Viral Coefficient – Quick Study and Social Network Implications
Virality is a metric that has been borrowed from the field of epidemiology. It pertains to how quickly an element or content spreads through the population. Thus, these elements could be voluntarily or involuntarily adopted. Applying it to the world of digital content, I will restrict my scope to that of voluntary adoption by participants who have come into contact with the elements.
The two driving factors around virality relate to Viral Coefficient and Viral Cycle Time. They are mutually exclusive concepts, but once put together in a tight system within the context of product design for dissemination, it becomes a very powerful customer acquisition tool. However, this certainly does not mean that increased virality will lead to increased profits. We will touch upon this subject later on for in doing so we have to assess what profit means – in other words, the various components in the profit equation and whether virality has any consequence to the result. Introducing profit motive in a viral environment could, on the other hand, lead to counterfactual consequences and may depress the virality coefficient and entropy the network.
What is the Viral Coefficient?
You will often hear the Viral Coefficient referred to as K. For example, you start an application that you put out on the web as a private beta. You offer them the tool to invite their contacts to register for the application. For example, if you start off with 10 private beta testers, and each of them invites 10 friends and let us say 20% of the 10 friends actually convert to be a registered user. What does this mean mathematically as we step through the first cycle? Incrementally, that would mean 10*10*20% = 20 new users that will be generated by your initial ten users. So at the end of the first cycle, you would have 30 users. But bear in mind that this is the first cycle only. Now the 30 users have the Invite tool to send to 10 additional users of which 10% convert. What does that translate to? It would be 30*10*10% =30 additional people over the base of 30 of your current installed based. That means now you have a total of 60 users. So you have essentially sent out 100 invites and then another 300 invites for a total of 400 invites — you have converted 50 users out of the 400 invites which translates to a 12.5% conversion rate through the second cycle. In general, you will find that as you step through more cycles, your conversion percentage will actually decay. In the first cycle, the viral coefficient (K) = 2 (Number of Invites (10) * conversion percentage (20%)), and through the incremental second cycle (K) = 10% (Number of Invites (10) * conversion percentage (10%)), and the total viral coefficient (K) is 1. If the K < 1, the system lends itself to decay … the pace of decay being a function of how low the viral coefficient is. On the other hand if you have K>1 or 100%, then your system will grow fairly quickly. The actual growth will be based on you starting base. A large starting base with K>1 is a fairly compelling model for growth.

The Viral Cycle Time:
This is the response time of a recipient to act upon an invite and send it out to their connection. In other words, using the above example, when your 10 users send out 10 invites and they are immediately acted upon ( for modeling simplicity, immediate means getting the invite and turning it around and send additional invites immediately and so on and on), that constitutes the velocity of the viral cycle otherwise known as Viral Cycle time. The growth and adoption of your product is a function of the viral cycle time. In other words, the longer the viral cycle time, the growth is significantly lower than a shorter viral cycle time. For example if you reduce viral cycle time by ½, you may experience 100X+ growth. Thus, it is another important lever to manage the growth and adoption of the application.

So when one speaks of Virality, we have to consider the Virality Coefficient and the Viral Cycle Time. These are the key components and the drivers to these components may have dependencies, but there could be some mutually exclusive underlying value drivers. Virality hence must be built into the product. It is often common to think that marketing creates virality. I believe that marketing certainly does influence virality but it is more important, if and when possible, to design the product with the viral hooks.
Risk Management and Finance
If you are in finance, you are a risk manager. Say what? Risk management! Imagine being the hub in a spoke of functional areas, each of which is embedded with a risk pattern that can vary over time. A sound finance manager would be someone who would be best able to keep pulse, and be able to support the decisions that can contain the risk. Thus, value management becomes critical: Weighing the consequence of a decision against the risk that the decision poses. Not cost management, but value management. And to make value management more concrete, we turn to cash impact or rather – the discounted value of future stream of cash that may or may not be a consequent to a decision. Companies carry risks. If not, a company will not offer any premiums in value to the market. They create competitive advantage – defined as sorting a sustained growth in free cash flow as the key metric that becomes the separator.
John Kay, an eminent strategist, had identified four sources of competitive advantage: Organization Architecture and Culture, Reputation, Innovation and Strategic Assets. All of these are inextricably intertwined, and must be aligned to service value in the company. The business value approach underpins the interrelationships best. And in so doing, scenario planning emerges as a sound machination to manage risks. Understanding the profit impact of a strategy, and the capability/initiative tie-in is one of the most crucial conversations that a good finance manager could encourage in a company. Product, market and internal capabilities become the anchor points in evolving discussions. Scenario planning thus emerges in context of trends and uncertainties: a trend in patterns may open up possibilities, the latter being in the domain of uncertainty.
There are multiple methods one could use in building scenarios and engaging in fruitful risk assessment.
1.Sensitivity Assessment: Evaluate decisions in the context of the strategy’s reliance on the resilience of business conditions. Assess the various conditions in a scenario or mutually exclusive scenarios, assess a probabilistic guesstimate on success factors, and then offer simple solutions. This assessment tends to be heuristic oriented and excellent when one is dealing with few specific decisions to be made. There is an elevated sense of clarity with regard to the business conditions that may present itself. And this is most commonly used, but does not thwart the more realistic conditions where clarity is obfuscated and muddy.
2.Strategy Evaluation: Use scenarios to test a strategy by throwing a layer of interaction complexity. To the extent you can disaggregate the complexity, the evaluation of a strategy is better tenable. But once again, disaggregation has its downsides. We don’t operate in a vacuum. It is the aggregation, and negotiating through this aggregation effectively is where the real value is. You may have heard of the Mckinsey MECE (Mutually Exclusive; Comprehensively Exhaustive) methodology where strategic thrusts are disaggregated and contained within a narrow framework. The idea is that if one does that enough, one has an untrammeled confidence in choosing one initiative over another. That is true again in some cases, but my belief is that the world operates at a more synthetic level than pure analytic. We resort to analytics since it is too damned hard to synthesize, and be able to agree on an optimal solution. I am not creaming analytics; I am only suggesting that there is some possibility that a false hypothesis is accepted and a true one rejected. Thus analytics is an important tool, but must be weighed along with the synthetic tradition.
3.Synthetic Development: By far the most interesting and perhaps the most controversial with glint of academic and theoretical monstrosities included – this represents developing and broadcasting all scenarios equally weighed, and grouping interaction of scenarios. Thus, if introducing a multi-million dollar initiative in untested waters is a decision you have to weigh, one must go through the first two methods, and then review the final outcome against peripheral factors that were not introduced initially. A simple statement or realization like – The competition for Southwest is the Greyhound bus – could significantly alter the expanse of the strategy.
If you think of the new world of finance being nothing more than crunching numbers … stop and think again. Yes …crunching those numbers play a big part, less a cause than an effect of the mental model that you appropriate in this prized profession.
