Blog Archives
The CFO as Chief Option Architect: Embracing Uncertainty
Part I: Embracing the Options Mindset
This first half explores the philosophical and practical foundation of real options thinking, scenario-based planning, and the CFO’s evolving role in navigating complexity. The voice is grounded in experience, built on systems thinking, and infused with a deep respect for the unpredictability of business life.
I learned early that finance, for all its formulas and rigor, rarely rewards control. In one of my earliest roles, I designed a seemingly watertight budget, complete with perfectly reconciled assumptions and cash flow projections. The spreadsheet sang. The market didn’t. A key customer delayed a renewal. A regulatory shift in a foreign jurisdiction quietly unraveled a tax credit. In just six weeks, our pristine model looked obsolete. I still remember staring at the same Excel sheet and realizing that the budget was not a map, but a photograph, already out of date. That moment shaped much of how I came to see my role as a CFO. Not as controller-in-chief, but as architect of adaptive choices.

The world has only become more uncertain since. Revenue operations now sit squarely in the storm path of volatility. Between shifting buying cycles, hybrid GTM models, and global macro noise, what used to be predictable has become probabilistic. Forecasting a quarter now feels less like plotting points on a trendline and more like tracing potential paths through fog. It is in this context that I began adopting and later, championing, the role of the CFO as “Chief Option Architect.” Because when prediction fails, design must take over.
This mindset draws deeply from systems thinking. In complex systems, what matters is not control, but structure. A system that adapts will outperform one that resists. And the best way to structure flexibility, I have found, is through the lens of real options. Borrowed from financial theory, real options describe the value of maintaining flexibility under uncertainty. Instead of forcing an all-in decision today, you make a series of smaller decisions, each one preserving the right, but not the obligation, to act in a future state. This concept, though rooted in asset pricing, holds powerful relevance for how we run companies.
When I began modeling capital deployment for new GTM motions, I stopped thinking in terms of “budget now, or not at all.” Instead, I started building scenario trees. Each branch represented a choice: deploy full headcount at launch or split into a two-phase pilot with a learning checkpoint. Invest in a new product SKU with full marketing spend, or wait for usage threshold signals to pass before escalation. These decision trees capture something that most budgets never do—the reality of the paths not taken, the contingencies we rarely discuss. And most importantly, they made us better at allocating not just capital, but attention. I am sharing my Bible on this topic, which was referred to me by Dr. Alexander Cassuto at Cal State Hayward in the Econometrics course. It was definitely more pleasant and easier to read than Jiang’s book on Econometrics.
This change in framing altered my approach to every part of revenue operations. Take, for instance, the deal desk. In traditional settings, deal desk is a compliance checkpoint where pricing, terms, and margin constraints are reviewed. But when viewed through an options lens, the deal desk becomes a staging ground for strategic bets. A deeply discounted deal might seem reckless on paper, but if structured with expansion clauses, usage gates, or future upsell options, it can behave like a call option on account growth. The key is to recognize and price the option value. Once I began modeling deals this way, I found we were saying “yes” more often, and with far better clarity on risk.
Data analytics became essential here not for forecasting the exact outcome, but for simulating plausible ones. I leaned heavily on regression modeling, time-series decomposition, and agent-based simulation. We used R to create time-based churn scenarios across customer cohorts. We used Arena to simulate resource allocation under delayed expansion assumptions. These were not predictions. They were controlled chaos exercises, designed to show what could happen, not what would. But the power of this was not just in the results, but it was in the mindset it built. We stopped asking, “What will happen?” and started asking, “What could we do if it does?”
From these simulations, we developed internal thresholds to trigger further investment. For example, if three out of five expansion triggers were fired, such as usage spike, NPS improvement, and additional department adoption, then we would greenlight phase two of GTM spend. That logic replaced endless debate with a predefined structure. It also gave our board more confidence. Rather than asking them to bless a single future, we offered a roadmap of choices, each with its own decision gates. They didn’t need to believe our base case. They only needed to believe we had options.
Yet, as elegant as these models were, the most difficult challenge remained human. People, understandably, want certainty. They want confidence in forecasts, commitment to plans, and clarity in messaging. I had to coach my team and myself to get comfortable with the discomfort of ambiguity. I invoked the concept of bounded rationality from decision science: we make the best decisions we can with the information available to us, within the time allotted. There is no perfect foresight. There is only better framing.
This is where the law of unintended consequences makes its entrance. In traditional finance functions, overplanning often leads to rigidity. You commit to hiring plans that no longer make sense three months in. You promise CAC thresholds that collapse under macro pressure. You bake linearity into a market that moves in waves. When this happens, companies double down, pushing harder against the wrong wall. But when you think in options, you pull back when the signal tells you to. You course-correct. You adapt. And paradoxically, you appear more stable.
As we embedded this thinking deeper into our revenue operations, we also became more cross-functional. Sales began to understand the value of deferring certain go-to-market investments until usage signals validated demand. Product began to view feature development as portfolio choices: some high-risk, high-return, others safer but with less upside. Customer Success began surfacing renewal and expansion probabilities not as binary yes/no forecasts, but as weighted signals on a decision curve. The shared vocabulary of real options gave us a language for navigating ambiguity together.
We also brought this into our capital allocation rhythm. Instead of annual budget cycles, we moved to rolling forecasts with embedded thresholds. If churn stayed below 8% and expansion held steady, we would greenlight an additional five SDRs. If product-led growth signals in EMEA hit critical mass, we’d fund a localized support pod. These weren’t whims. They were contingent commitments, bound by logic, not inertia. And that changed everything.
The results were not perfect. We made wrong bets. Some options expired worthless. Others took longer to mature than we expected. But overall, we made faster decisions with greater alignment. We used our capital more efficiently. And most of all, we built a culture that didn’t flinch at uncertainty—but designed for it.
In the next part of this essay, I will go deeper into the mechanics of implementing this philosophy across the deal desk, QTC architecture, and pipeline forecasting. I will also show how to build dashboards that visualize decision trees and option paths, and how to teach your teams to reason probabilistically without losing speed. Because in a world where volatility is the only certainty, the CFO’s most enduring edge is not control, but it is optionality, structured by design and deployed with discipline.
Part II: Implementing Option Architecture Inside RevOps
A CFO cannot simply preach agility from a whiteboard. To embed optionality into the operational fabric of a company, the theory must show up in tools, in dashboards, in planning cadences, and in the daily decisions made by deal desks, revenue teams, and systems owners. I have found that fundamental transformation comes not from frameworks, but from friction—the friction of trying to make the idea work across functions, under pressure, and at scale. That’s where option thinking proves its worth.
We began by reimagining the deal desk, not as a compliance stop but as a structured betting table. In conventional models, deal desks enforce pricing integrity, review payment terms, and ensure T’s and C’s fall within approved tolerances. That’s necessary, but not sufficient. In uncertain environments—where customer buying behavior, competitive pressure, or adoption curves wobble without warning: rigid deal policies become brittle. The opportunity lies in recasting the deal desk as a decision node within a larger options tree.
Consider a SaaS enterprise deal involving land-and-expand potential. A rigid model forces either full commitment upfront or defers expansion, hoping for a vague “later.” But if we treat the deal like a compound call option, we see more apparent logic. You price the initial land deal aggressively, with usage-based triggers that, when met, unlock favorable expansion terms. You embed a re-pricing clause if usage crosses a defined threshold in 90 days. You insert a “soft commit” expansion clause tied to the active user count. None of these is just a term. They are embedded with real options. And when structured well, they deliver upside without requiring the customer to commit to uncertain future needs.
In practice, this approach meant reworking CPQ systems, retraining legal, and coaching reps to frame options credibly. We designed templates with optionality clauses already coded into Salesforce workflows. Once an account crossed a pre-defined trigger say, 80% license utilization, then the next best action flowed to the account executive and customer success manager. The logic wasn’t linear. It was branching. We visualized deal paths in a way that corresponds to mapping a decision tree in a risk-adjusted capital model.
Yet even the most elegant structure can fail if the operating rhythm stays linear. That is why we transitioned away from rigid quarterly forecasts toward rolling scenario-based planning. Forecasting ceased to be a spreadsheet contest. Instead, we evaluated forecast bands, not point estimates. If base churn exceeded X% in a specific cohort, how did that impact our expansion coverage ratio? If deal velocity in EMEA slowed by two weeks, how would that compress the bookings-to-billings gap? We visualized these as cascading outcomes, not just isolated misses.
To build this capability, we used what I came to call “option dashboards.” These were layered, interactive models with inputs tied to a live pipeline and post-sale telemetry. Each card on the dashboard represented a decision node—an inflection point. Would we deploy more headcount into SMB if the average CAC-to-LTV fell below 3:1? Would we pause feature rollout in one region to redirect support toward a segment with stronger usage signals? Each choice was pre-wired with boundary logic. The decisions didn’t live in a drawer—they lived in motion.
Building these dashboards required investment. But more than tools, it required permission. Teams needed to know they could act on signal, not wait for executive validation every time a deviation emerged. We institutionalized the language of “early signal actionability.” If revenue leaders spotted a decline in renewal health across a cluster of customers tied to the same integration module, they didn’t wait for a churn event. They pulled forward roadmap fixes. That wasn’t just good customer service, but it was real options in flight.
This also brought a new flavor to our capital allocation rhythm. Rather than annual planning cycles that locked resources into static swim lanes, we adopted gated resourcing tied to defined thresholds. Our FP&A team built simulation models in Python and R, forecasting the expected value of a resourcing move based on scenario weightings. For example, if a new vertical showed a 60% likelihood of crossing a 10-deal threshold by mid-Q3, we pre-approved GTM spend to activate contingent on hitting that signal. This looked cautious to some. But in reality, it was aggressive and in the right direction, at the right moment.
Throughout all of this, I kept returning to a central truth: uncertainty punishes rigidity, but rewards those who respect its contours. A pricing policy that cannot flex will leave margin on the table or kill deals in flight. A hiring plan that commits too early will choke working capital. And a CFO who waits for clarity before making bets will find they arrive too late. In decision theory, we often talk about “the cost of delay” versus “the cost of error.” A good options model minimizes both, which, interestingly, is not by being just right, but by being ready.
Of course, optionality without discipline can devolve into indecision. We embedded guardrails. We defined thresholds that made decision inertia unacceptable. If a cohort’s NRR dropped for three consecutive months and win-back campaigns failed, we sunsetted that motion. If a beta feature was unable to hit usage velocity within a quarter, we reallocated the development budget. These were not emotional decisions, but they were logical conclusions of failed options. And we celebrated them. A failed option, tested and closed, beats a zombie investment every time.
We also revised our communication with the board. Instead of defending fixed forecasts, we presented probability-weighted trees. “If churn holds, and expansion triggers fire, we’ll beat target by X.” “If macro shifts pull SMB renewals down by 5%, we stay within plan by flexing mid-market initiatives.” This shifted the conversation from finger-pointing to scenario readiness. Investors liked it. More importantly, so did the executive team. We could disagree on base assumptions but still align on decisions because we’d mapped the branches ahead of time.
One area where this thought made an outsized impact was compensation planning. Sales comp is notoriously fragile under volatility. We redesigned quota targets and commission accelerators using scenario bands, not fixed assumptions. We tested payout curves under best, base, and downside cases. We then ran Monte Carlo simulations to see how frequently actuals would fall into the “too much upside” or “demotivating downside” zones. This led to more durable comp plans, which meant fewer panicked mid-year resets. Our reps trusted the system. And our CFO team could model cost predictability with far greater confidence.
In retrospection, all these loops back to a single mindset shift: you don’t plan to be right. You plan to stay in the game. And staying in the game requires options that are well-designed, embedded into the process, and respected by every function. Sales needs to know they can escalate an expansion offer once particular customer signals fire. Success needs to know they have the budget authority to engage support when early churn flags arise. Product needs to know they can pause a roadmap stream if NPV no longer justifies it. And finance needs to know that its most significant power is not in control, but in preparation.
Today, when I walk into a revenue operations review or a strategic planning offsite, I do not bring a budget with fixed forecasts. I get a map. It has branches. It has signals. It has gates. And it has options, and each one designed not to predict the future, but to help us meet it with composure, and to move quickly when the fog clears.
Because in the world I have operated in, spanning economic cycles, geopolitical events, sudden buyer hesitation, system failures, and moments of exponential product success since 1994 until now, one principle has held. The companies that win are not the ones who guess right. They are the ones who remain ready. And readiness, I have learned, is the true hallmark of a great CFO.
Precision at Scale: How to Grow Without Drowning in Complexity
In business, as in life, scale is seductive. It promises more of the good things—revenue, reach, relevance. But it also invites something less welcome: complexity. And the thing about complexity is that it doesn’t ask for permission before showing up. It simply arrives, unannounced, and tends to stay longer than you’d like.
As we pursue scale, whether by growing teams, expanding into new markets, or launching adjacent product lines, we must ask a question that seems deceptively simple: how do we know we’re scaling the right way? That question is not just philosophical—it’s deeply economic. The right kind of scale brings leverage. The wrong kind brings entropy.

Now, if I’ve learned anything from years of allocating capital, it is this: returns come not just from growth, but from managing the cost and coordination required to sustain that growth. In fact, the most successful enterprises I’ve seen are not the ones that scaled fastest. They’re the ones that scaled precisely. So, let’s get into how one can scale thoughtfully, without overinvesting in capacity, and how to tell when the system you’ve built is either flourishing or faltering.
To begin, one must understand that scale and complexity do not rise in parallel; complexity has a nasty habit of accelerating. A company with two teams might have a handful of communication lines. Add a third team, and you don’t just add more conversations—you add relationships between every new and existing piece. In engineering terms, it’s a combinatorial explosion. In business terms, it’s meetings, misalignment, and missed expectations.
Cities provide a useful analogy. When they grow in population, certain efficiencies appear. Infrastructure per person often decreases, creating cost advantages. But cities also face nonlinear rises in crime, traffic, and disease—all manifestations of unmanaged complexity. The same is true in organizations. The system pays a tax for every additional node, whether that’s a service, a process, or a person. That tax is complexity, and it compounds.
Knowing this, we must invest in capacity like we would invest in capital markets—with restraint and foresight. Most failures in capacity planning stem from either a lack of preparation or an excess of confidence. The goal is to invest not when systems are already breaking, but just before the cracks form. And crucially, to invest no more than necessary to avoid those cracks.
Now, how do we avoid overshooting? I’ve found that the best approach is to treat capacity like runway. You want enough of it to support takeoff, but not so much that you’ve spent your fuel on unused pavement. We achieve this by investing in increments, triggered by observable thresholds. These thresholds should be quantitative and predictive—not merely anecdotal. If your servers are running at 85 percent utilization across sustained peak windows, that might justify additional infrastructure. If your engineering lead time starts rising despite team growth, it suggests friction has entered the system. Either way, what you’re watching for is not growth alone, but whether the system continues to behave elegantly under that growth.
Elegance matters. Systems that age well are modular, not monolithic. In software, this might mean microservices that scale independently. In operations, it might mean regional pods that carry their own load, instead of relying on a centralized command. Modular systems permit what I call “selective scaling”—adding capacity where needed, without inflating everything else. It’s like building a house where you can add another bedroom without having to reinforce the foundation. That kind of flexibility is worth gold.
Of course, any good decision needs a reliable forecast behind it. But forecasting is not about nailing the future to a decimal point. It is about bounding uncertainty. When evaluating whether to scale, I prefer forecasts that offer a range—base, best, and worst-case scenarios—and then tie investment decisions to the 75th percentile of demand. This ensures you’re covering plausible upside without betting on the moon.
Let’s not forget, however, that systems are only as good as the signals they emit. I’m wary of organizations that rely solely on lagging indicators like revenue or margin. These are important, but they are often the last to move. Leading indicators—cycle time, error rates, customer friction, engineer throughput—tell you much sooner whether your system is straining. In fact, I would argue that latency, broadly defined, is one of the clearest signs of stress. Latency in delivery. Latency in decisions. Latency in feedback. These are the early whispers before systems start to crack.
To measure whether we’re making good decisions, we need to ask not just if outcomes are improving, but if the effort to achieve them is becoming more predictable. Systems with high variability are harder to scale because they demand constant oversight. That’s a recipe for executive burnout and organizational drift. On the other hand, systems that produce consistent results with declining variance signal that the business is not just growing—it’s maturing.
Still, even the best forecasts and the finest metrics won’t help if you lack the discipline to say no. I’ve often told my teams that the most underrated skill in growth is the ability to stop. Stopping doesn’t mean failure; it means the wisdom to avoid doubling down when the signals aren’t there. This is where board oversight matters. Just as we wouldn’t pour more capital into an underperforming asset without a turn-around plan, we shouldn’t scale systems that aren’t showing clear returns.
So when do we stop? There are a few flags I look for. The first is what I call capacity waste—resources allocated but underused, like a datacenter running at 20 percent utilization, or a support team waiting for tickets that never come. That’s not readiness. That’s idle cost. The second flag is declining quality. If error rates, customer complaints, or rework spike following a scale-up, then your complexity is outpacing your coordination. Third, I pay attention to cognitive load. When decision-making becomes a game of email chains and meeting marathons, it’s time to question whether you’ve created a machine that’s too complicated to steer.
There’s also the budget creep test. If your capacity spending increases by more than 10 percent quarter over quarter without corresponding growth in throughput, you’re not scaling—you’re inflating. And in inflation, as in business, value gets diluted.
One way to guard against this is by treating architectural reserves like financial ones. You wouldn’t deploy your full cash reserve just because an opportunity looks interesting. You’d wait for evidence. Similarly, system buffers should be sized relative to forecast volatility, not organizational ambition. A modest buffer is prudent. An oversized one is expensive insurance.
Some companies fall into the trap of building for the market they hope to serve, not the one they actually have. They build as if the future were guaranteed. But the future rarely offers such certainty. A better strategy is to let the market pull capacity from you. When customers stretch your systems, then you invest. Not because it’s a bet, but because it’s a reaction to real demand.
There’s a final point worth making here. Scaling decisions are not one-time events. They are sequences of bets, each informed by updated evidence. You must remain agile enough to revise the plan. Quarterly evaluations, architectural reviews, and scenario testing are the boardroom equivalent of course correction. Just as pilots adjust mid-flight, companies must recalibrate as assumptions evolve.
To bring this down to earth, let me share a brief story. A fintech platform I advised once found itself growing at 80 percent quarter over quarter. Flush with success, they expanded their server infrastructure by 200 percent in a single quarter. For a while, it worked. But then something odd happened. Performance didn’t improve. Latency rose. Error rates jumped. Why? Because they hadn’t scaled the right parts. The orchestration layer, not the compute layer, was the bottleneck. Their added capacity actually increased system complexity without solving the real issue. It took a re-architecture, and six months of disciplined rework, to get things back on track. The lesson: scaling the wrong node is worse than not scaling at all.
In conclusion, scale is not the enemy. But ungoverned scale is. The real challenge is not growth, but precision. Knowing when to add, where to reinforce, and—perhaps most crucially—when to stop. If we build systems with care, monitor them with discipline, and remain intellectually honest about what’s working, we give ourselves the best chance to grow not just bigger, but better.
And that, to borrow a phrase from capital markets, is how you compound wisely.
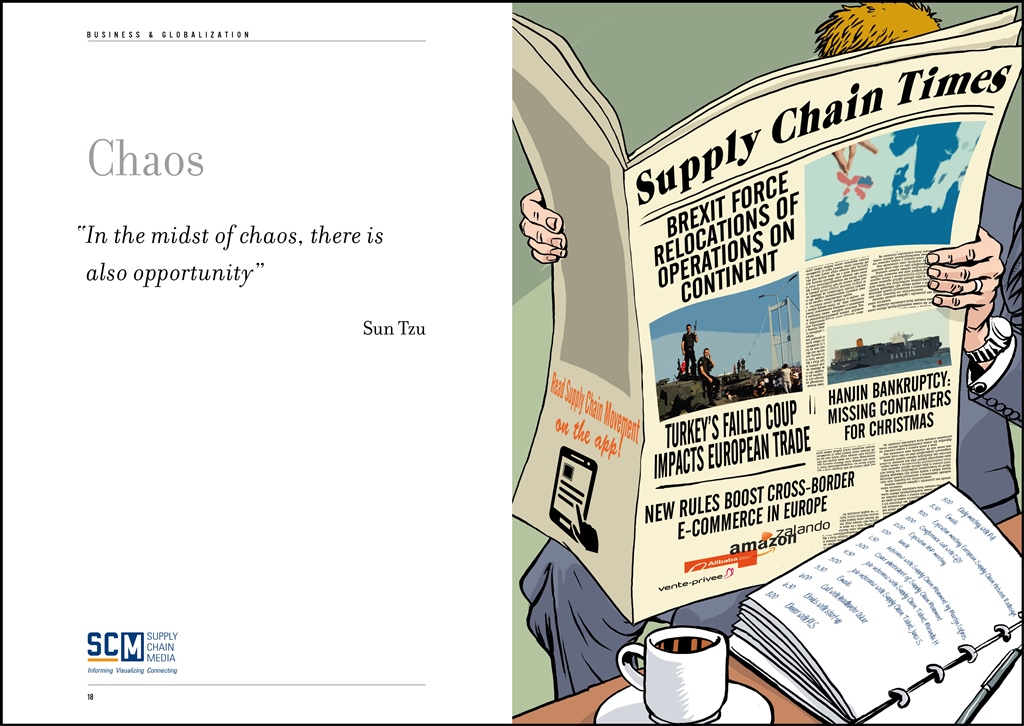
Navigating Chaos and Model Thinking
An inherent property of a chaotic system is that slight changes in initial conditions in the system result in a disproportionate change in outcome that is difficult to predict. Chaotic systems appear to create outcomes that appear to be random: they are generated by simple and non-random processes but the complexity of such systems emerge over time driven by numerous iterations of simple rules. The elements that compose chaotic systems might be few in number, but these elements work together to produce an intricate set of dynamics that amplifies the outcome and makes it hard to be predictable. These systems evolve over time, doing so according to rules and initial conditions and how the constituent elements work together.

Complex systems are characterized by emergence. The interactions between the elements of the system with its environment create new properties which influence the structural development of the system and the roles of the agents. In such systems there is self-organization characteristics that occur, and hence it is difficult to study and effect a system by studying the constituent parts that comprise it. The task becomes even more formidable when one faces the prevalent reality that most systems exhibit non-linear dynamics.
So how do we incorporate management practices in the face of chaos and complexity that is inherent in organization structure and market dynamics? It would be interesting to study this in light of the evolution of management principles in keeping with the evolution of scientific paradigms.
Newtonian Mechanics and Taylorism
Traditional organization management has been heavily influenced by Newtonian mechanics. The five key assumptions of Newtonian mechanics are:
- Reality is objective
- Systems are linear and there is a presumption that all underlying cause and effect are linear
- Knowledge is empirical and acquired through collecting and analyzing data with the focus on surfacing regularities, predictability and control
- Systems are inherently efficient. Systems almost always follows the path of least resistance
- If inputs and process is managed, the outcomes are predictable
Frederick Taylor is the father of operational research and his methods were deployed in automotive companies in the 1940’s. Workers and processes are input elements to ensure that the machine functions per expectations. There was a linearity employed in principle. Management role was that of observation and control and the system would best function under hierarchical operating principles. Mass and efficient production were the hallmarks of management goal.
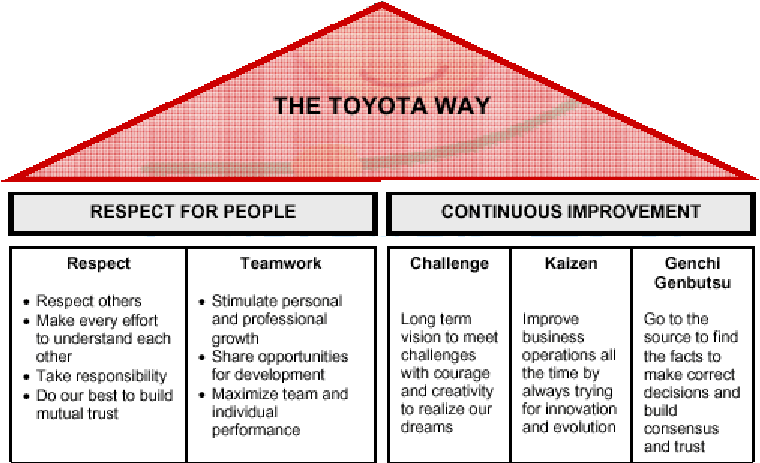
Randomness and the Toyota Way
The randomness paradigm recognized uncertainty as a pervasive constant. The various methods that Toyota Way invoked around 5W rested on the assumption that understanding the cause and effect is instrumental and this inclined management toward a more process-based deployment. Learning is introduced in this model as a dynamic variable and there is a lot of emphasis on the agents and providing them the clarity and purpose of their tasks. Efficiencies and quality are presumably driven by the rank and file and autonomous decisions are allowed. The management principle moves away from hierarchical and top-down to a more responsibility driven labor force.
Complexity and Chaos and the Nimble Organization
Increasing complexity has led to more demands on the organization. With the advent of social media and rapid information distribution and a general rise in consciousness around social impact, organizations have to balance out multiple objectives. Any small change in initial condition can lead to major outcomes: an advertising mistake can become a global PR nightmare; a word taken out of context could have huge ramifications that might immediately reflect on the stock price; an employee complaint could force management change. Increasing data and knowledge are not sufficient to ensure long-term success. In fact, there is no clear recipe to guarantee success in an age fraught with non-linearity, emergence and disequilibrium. To succeed in this environment entails the development of a learning organization that is not governed by fixed top-down rules: rather the rules are simple and the guidance is around the purpose of the system or the organization. It is best left to intellectual capital to self-organize rapidly in response to external information to adapt and make changes to ensure organization resilience and success.
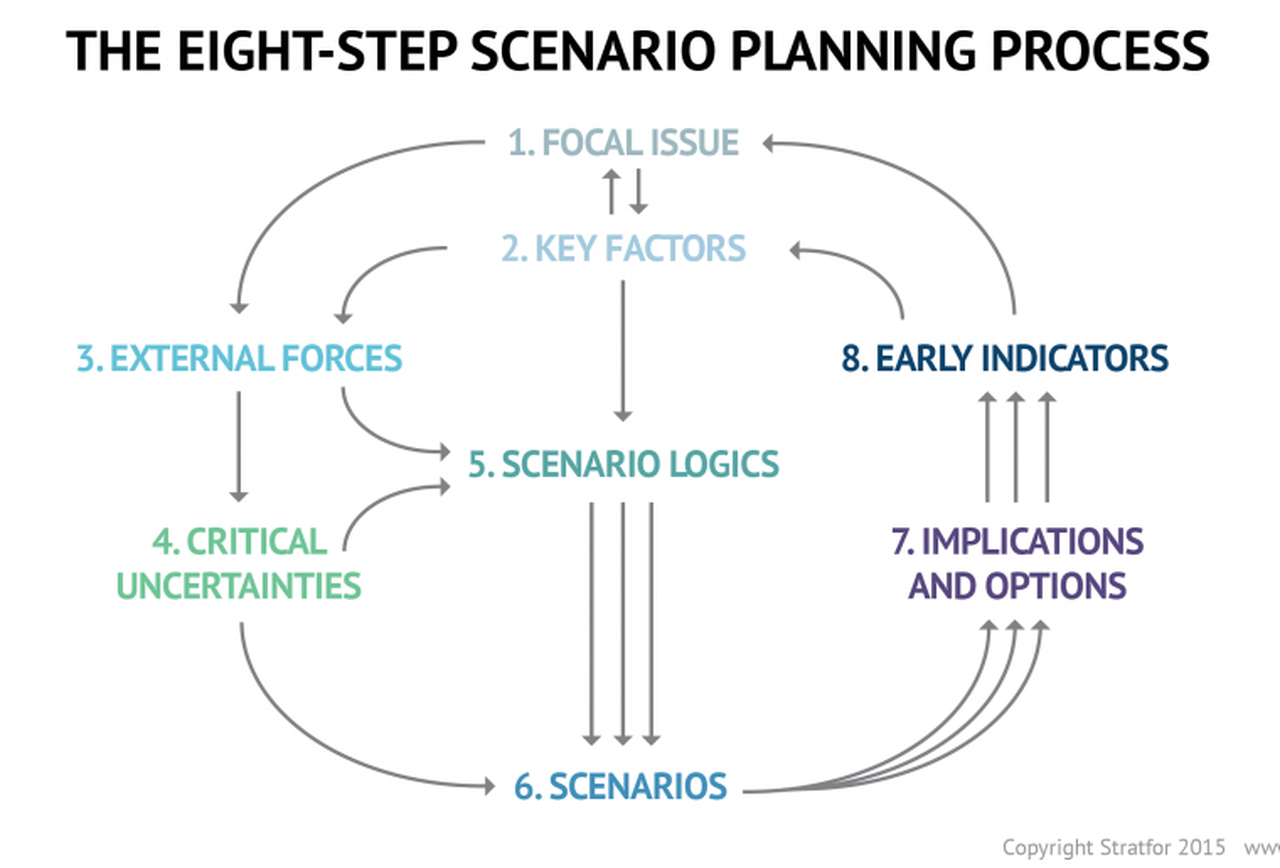
Companies are dynamic non-linear adaptive systems. The elements in the system are constantly interacting between themselves and their external environment. This creates new emergent properties that are sensitive to the initial conditions. A change in purpose or strategic positioning could set a domino effect and can lead to outcomes that are not predictable. Decisions are pushed out to all levels in the organization, since the presumption is that local and diverse knowledge that spontaneously emerge in response to stimuli is a superior structure than managing for complexity in a centralized manner. Thus, methods that can generate ideas, create innovation habitats, and embrace failures as providing new opportunities to learn are best practices that companies must follow. Traditional long-term planning and forecasting is becoming a far harder exercise and practically impossible. Thus, planning is more around strategic mindset, scenario planning, allowing local rules to auto generate without direct supervision, encourage dissent and diversity, stimulate creativity and establishing clarity of purpose and broad guidelines are the hall marks of success.
Principles of Leadership in a New Age
We have already explored the fact that traditional leadership models originated in the context of mass production and efficiencies. These models are arcane in our information era today, where systems are characterized by exponential dynamism of variables, increased density of interactions, increased globalization and interconnectedness, massive information distribution at increasing rapidity, and a general toward economies driven by free will of the participants rather than a central authority.

Complexity Leadership Theory (Uhl-Bien) is a “framework for leadership that enables the learning, creative and adaptive capacity of complex adaptive systems in knowledge-producing organizations or organizational units. Since planning for the long-term is virtually impossible, Leadership has to be armed with different tool sets to steer the organization toward achieving its purpose. Leaders take on enabler role rather than controller role: empowerment supplants control. Leadership is not about focus on traits of a single leader: rather, it redirects emphasis from individual leaders to leadership as an organizational phenomenon. Leadership is a trait rather than an individual. We recognize that complex systems have lot of interacting agents – in business parlance, which might constitute labor and capital. Introducing complexity leadership is to empower all of the agents with the ability to lead their sub-units toward a common shared purpose. Different agents can become leaders in different roles as their tasks or roles morph rapidly: it is not necessarily defined by a formal appointment or knighthood in title.
Thus, complexity of our modern-day reality demands a new strategic toolset for the new leader. The most important skills would be complex seeing, complex thinking, complex knowing, complex acting, complex trusting and complex being. (Elena Osmodo, 2012)

Complex Seeing: Reality is inherently subjective. It is a page of the Heisenberg Uncertainty principle that posits that the independence between the observer and the observed is not real. If leaders are not aware of this independence, they run the risk of engaging in decisions that are fraught with bias. They will continue to perceive reality with the same lens that they have perceived reality in the past, despite the fact that undercurrents and riptides of increasingly exponential systems are tearing away their “perceived reality.” Leader have to be conscious about the tectonic shifts, reevaluate their own intentions, probe and exclude biases that could cloud the fidelity of their decisions, and engage in a continuous learning process. The ability to sift and see through this complexity sets the initial condition upon which the entire system’s efficacy and trajectory rests.
Complex Thinking: Leaders have to be cognizant of falling prey to linear simple cause and effect thinking. On the contrary, leaders have to engage in counter-intuitive thinking, brainstorming and creative thinking. In addition, encouraging dissent, debates and diversity encourage new strains of thought and ideas.
Complex Feeling: Leaders must maintain high levels of energy and be optimistic of the future. Failures are not scoffed at; rather they are simply another window for learning. Leaders have to promote positive and productive emotional interactions. The leaders are tasked to increase positive feedback loops while reducing negative feedback mechanisms to the extent possible. Entropy and attrition taxes any system as is: the leader’s job is to set up safe environment to inculcate respect through general guidelines and leading by example.
Complex Knowing: Leadership is tasked with formulating simple rules to enable learned and quicker decision making across the organization. Leaders must provide a common purpose, interconnect people with symbols and metaphors, and continually reiterate the raison d’etre of the organization. Knowing is articulating: leadership has to articulate and be humble to any new and novel challenges and counterfactuals that might arise. The leader has to establish systems of knowledge: collective learning, collaborative learning and organizational learning. Collective learning is the ability of the collective to learn from experiences drawn from the vast set of individual actors operating in the system. Collaborative learning results due to interaction of agents and clusters in the organization. Learning organization, as Senge defines it, is “where people continually expand their capacity to create the results they truly desire, where new and expansive patterns of thinking are nurtured, where collective aspirations are set free, and where people are continually learning to see the whole together.”
Complex Acting: Complex action is the ability of the leader to not only work toward benefiting the agents in his/her purview, but also to ensure that the benefits resonates to a whole which by definition is greater than the sum of the parts. Complex acting is to take specific action-oriented steps that largely reflect the values that the organization represents in its environmental context.
Complex Trusting: Decentralization requires conferring power to local agents. For decentralization to work effectively, leaders have to trust that the agents will, in the aggregate, work toward advancing the organization. The cost of managing top-down is far more than the benefits that a trust-based decentralized system would work in a dynamic environment resplendent with the novelty of chaos and complexity.
Complex Being: This is the ability of the leaser to favor and encourage communication across the organization rapidly. The leader needs to encourage relationships and inter-functional dialogue.
The role of complex leaders is to design adaptive systems that are able to cope with challenging and novel environments by establishing a few rules and encouraging agents to self-organize autonomously at local levels to solve challenges. The leader’s main role in this exercise is to set the strategic directions and the guidelines and let the organizations run.
Chaos as a system: New Framework
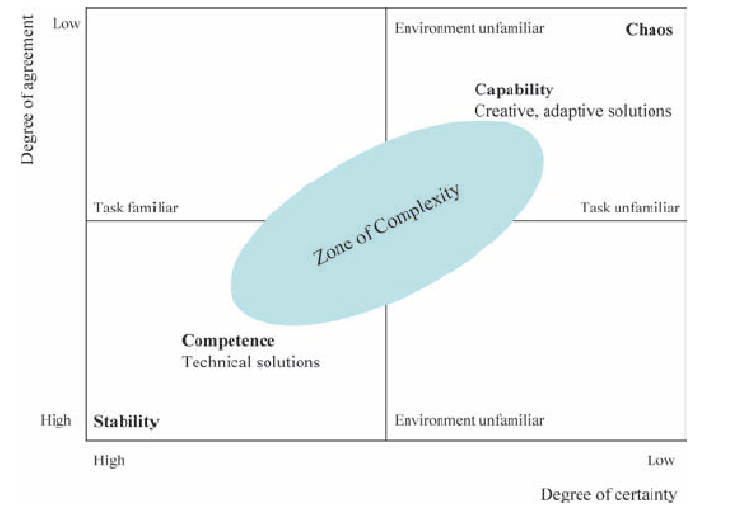
Chaos is not an unordered phenomenon. There is a certain homeostatic mechanism at play that forces a system that might have inherent characteristics of a “chaotic” process to converge to some sort of stability with respect to predictability and parallelism. Our understanding of order which is deemed to be opposite of chaos is the fact that there is a shared consensus that the system will behave in an expected manner. Hence, we often allude to systems as being “balanced” or “stable” or “in order” to spotlight these systems. However, it is also becoming common knowledge in the science of chaos that slight changes in initial conditions in a system can emit variability in the final output that might not be predictable. So how does one straddle order and chaos in an observed system, and what implications does this process have on ongoing study of such systems?

Chaotic systems can be considered to have a highly complex order. It might require the tools of pure mathematics and extreme computational power to understand such systems. These tools have invariably provided some insights into chaotic systems by visually representing outputs as re-occurrences of a distribution of outputs related to a given set of inputs. Another interesting tie up in this model is the existence of entropy, that variable that taxes a system and diminishes the impact on expected outputs. Any system acts like a living organism: it requires oodles of resources to survive and a well-established set of rules to govern its internal mechanism driving the vector of its movement. Suddenly, what emerges is the fact that chaotic systems display some order while subject to an inherent mechanism that softens its impact over time. Most approaches to studying complex and chaotic systems involve understanding graphical plots of fractal nature, and bifurcation diagrams. These models illustrate very complex re occurrences of outputs directly related to inputs. Hence, complex order occurs from chaotic systems.
A case in point would be the relation of a population parameter in the context to its immediate environment. It is argued that a population in an environment will maintain a certain number and there would be some external forces that will actively work to ensure that the population will maintain at that standard number. It is a very Malthusian analytic, but what is interesting is that there could be some new and meaningful influences on the number that might increase the scale. In our current meaning, a change in technology or ingenuity could significantly alter the natural homeostatic number. The fact remains that forces are always at work on a system. Some systems are autonomic – it self-organizes and corrects itself toward some stable convergence. Other systems are not autonomic and once can only resort to the laws of probability to get some insight into the possible outputs – but never to a point where there is a certainty in predictive prowess.
Organizations have a lot of interacting variables at play at any given moment. In order to influence the organization behavior or/and direction, policies might be formulated to bring about the desirable results. However, these nudges toward setting off the organization in the right direction might also lead to unexpected results. The aim is to foresee some of these unexpected results and mollify the adverse consequences while, in parallel, encourage the system to maximize the benefits. So how does one effect such changes?
It all starts with building out an operating framework. There needs to be a clarity around goals and what the ultimate purpose of the system is. Thus there are few objectives that bind the framework.
- Clarity around goals and the timing around achieving these goals. If there is no established time parameter, then the system might jump across various states over time and it would be difficult to establish an outcome.
- Evaluate all of the internal and external factors that might operate in the framework that would impact the success of organizational mandates and direction. Identify stasis or potential for stasis early since that mental model could stem the progress toward a desirable impact.
- Apply toll gates strategically to evaluate if the system is proceeding along the lines of expectation, and any early aberrations are evaluated and the rules are tweaked to get the system to track on a desirable trajectory.
- Develop islands of learning across the path and engage the right talent and other parameters to force adaptive learning and therefore a more autonomic direction to the system.
- Bind the agents and actors in the organization to a shared sense of purpose within the parameter of time.
- Introduce diversity into the framework early in the process. The engagement of diversity allows the system to modulate around a harmonic mean.
- Finally, maintain a well document knowledge base such that the accretive learning that results due to changes in the organization become springboard for new initiatives that reduces the costs of potential failures or latency in execution.
- Encouraging the leadership to ensure that the vector is pointed toward the right direction at any given time.
Once a framework and the engagement rules are drawn out, it is necessary to rely on the natural velocity and self-organization of purposeful agents to move the agenda forward, hopefully with little or no intervention. A mechanism of feedback loops along the way would guide the efficacy of the direction of the system. The implications is that the strategy and the operations must be aligned and reevaluated and positive behavior is encouraged to ensure that the systems meets its objective.

However, as noted above, entropy is a dynamic that often threatens to derail the system objective. There will be external or internal forces constantly at work to undermine system velocity. The operating framework needs to anticipate that real possibility and pre-empt that with rules or introduction of specific capital to dematerialize these occurrences. Stasis is an active agent that can work against the system dynamic. Stasis is the inclination of agents or behaviors that anchors the system to some status quo – we have to be mindful that change might not be embraced and if there are resistors to that change, the dynamic of organizational change can be invariably impacted. It will take a lot more to get something done than otherwise needed. Identifying stasis and agents of stasis is a foundational element
While the above is one example of how to manage organizations in the shadows of the properties of how chaotic systems behave, another example would be the formulation of strategy of the organization in responses to external forces. How do we apply our learnings in chaos to deal with the challenges of competitive markets by aligning the internal organization to external factors? One of the key insights that chaos surfaces is that it is nigh impossible for one to fully anticipate all of the external variables, and leaving the system to dynamically adapt organically to external dynamics would allow the organization to thrive. To thrive in this environment is to provide the organization to rapidly change outside of the traditional hierarchical expectations: when organizations are unable to make those rapid changes or make strategic bets in response to the external systems, then the execution value of the organization diminishes.
Margaret Wheatley in her book Leadership and the New Science: Discovering Order in a Chaotic World Revised says, “Organizations lack this kind of faith, faith that they can accomplish their purposes in various ways and that they do best when they focus on direction and vision, letting transient forms emerge and disappear. We seem fixated on structures…and organizations, or we who create them, survive only because we build crafty and smart—smart enough to defend ourselves from the natural forces of destruction. Karl Weick, an organizational theorist, believes that “business strategies should be “just in time…supported by more investment in general knowledge, a large skill repertoire, the ability to do a quick study, trust in intuitions, and sophistication in cutting losses.”
We can expand the notion of a chaos in a system to embrace the bigger challenges associated with environment, globalization, and the advent of disruptive technologies.
One of the key challenges to globalization is how policy makers would balance that out against potential social disintegration. As policies emerge to acknowledge the benefits and the necessity to integrate with a new and dynamic global order, the corresponding impact to local institutions can vary and might even lead to some deleterious impact on those institutions. Policies have to encourage flexibility in local institutional capability and that might mean increased investments in infrastructure, creating a diverse knowledge base, establishing rules that govern free but fair trading practices, and encouraging the mobility of capital across borders. The grand challenges of globalization is weighed upon by government and private entities that scurry to create that continual balance to ensure that the local systems survive and flourish within the context of the larger framework. The boundaries of the system are larger and incorporates many more agents which effectively leads to the real possibility of systems that are difficult to be controlled via a hierarchical or centralized body politic Decision making is thus pushed out to the agents and actors but these work under a larger set of rules. Rigidity in rules and governance can amplify failures in this process.
Related to the realities of globalization is the advent of the growth in exponential technologies. Technologies with extreme computational power is integrating and create robust communication networks within and outside of the system: the system herein could represent nation-states or companies or industrialization initiatives. Will the exponential technologies diffuse across larger scales quickly and will the corresponding increase in adoption of new technologies change the future of the human condition? There are fears that new technologies would displace large groups of economic participants who are not immediately equipped to incorporate and feed those technologies into the future: that might be on account of disparity in education and wealth, institutional policies, and the availability of opportunities. Since technologies are exponential, we get a performance curve that is difficult for us to understand. In general, we tend to think linearly and this frailty in our thinking removes us from the path to the future sooner than later. What makes this difficult is that the exponential impact is occurring across various sciences and no one body can effectively fathom the impact and the direction. Bill Gates says it well “We always overestimate the change that will occur in the next two years and underestimate the change that will occur in the next ten. Don’t let yourself be lulled into inaction.” Does chaos theory and complexity science arm us with a differentiated tool set than the traditional toolset of strategy roadmaps and product maps? If society is being carried by the intractable and power of the exponent in advances in technology, than a linear map might not serve to provide the right framework to develop strategies for success in the long-term. Rather, a more collaborative and transparent roadmap to encourage the integration of thoughts and models among the actors who are adapting and adjusting dynamically by the sheer force of will would perhaps be an alternative and practical approach in the new era.

Lately there has been a lot of discussion around climate change. It has been argued, with good reason and empirical evidence, that environment can be adversely impacted on account of mass industrialization, increase in population, resource availability issues, the inability of the market system to incorporate the cost of spillover effects, the adverse impact of moral hazard and the theory of the commons, etc. While there are demurrers who contest the long-term climate change issues, the train seems to have already left the station! The facts do clearly reflect that the climate will be impacted. Skeptics might argue that science has not yet developed a precise predictive model of the weather system two weeks out, and it is foolhardy to conclude a dystopian future on climate fifty years out. However, the alternative argument is that our inability to exercise to explain the near-term effects of weather changes and turbulence does not negate the existence of climate change due to the accretion of greenhouse impact. Boiling a pot of water will not necessarily gives us an understanding of all of the convection currents involved among the water molecules, but it certainly does not shy away from the fact that the water will heat up.
History of Chaos
| Chaos is inherent in all compounded things. Strive on with diligence! –Buddha |
Scientific theories are characterized by the fact that they are open to refutation. To create a scientific model, there are three successive steps that one follows: observe the phenomenon, translate that into equations, and then solve the equations.

One of the early philosophers of science, Karl Popper (1902-1994) discussed this at great length in his book – The Logic of Scientific Discovery. He distinguishes scientific theories from metaphysical or mythological assertions. His main theses is that a scientific theory must be open to falsification: it has to be reproducible separately and yet one can gather data points that might refute the fundamental elements of theory. Developing a scientific theory in a manner that can be falsified by observations would result in new and more stable theories over time. Theories can be rejected in favor of a rival theory or a calibration of the theory in keeping with the new set of observations and outcomes that the theories posit. Until Popper’s time and even after, social sciences have tried to work on a framework that would allow the construction of models that would formulate some predictive laws that govern social dynamics. In his book, Poverty of Historicism, Popper maintained that such an endeavor is not fruitful since it does not take into consideration the myriad of minor elements that interact closely with one another in a meaningful way. Hence, he has touched indirectly on the concept of chaos and complexity and how it touches the scientific method. We will now journey into the past and through the present to understand the genesis of the theory and how it has been channelized by leading scientists and philosophers to decipher a framework for study society and nature.
As we have already discussed, one of the main pillars of Science is determinism: the probability of prediction. It holds that every event is determined by natural laws. Nothing can happen without an unbroken chain of causes that can be traced all the way back to an initial condition. The deterministic nature of science goes all the way back to Aristotelian times. Interestingly, Aristotle argued that there is some degree of indeterminism and he relegated this to chance or accidents. Chance is a character that makes its presence felt in every plot in the human and natural condition. Aristotle wrote that “we do not have knowledge of a thing until we have grasped its why, that is to say, its cause.” He goes on to illustrate his idea in greater detail – namely, that the final outcome that we see in a system is on account of four kinds of influencers: Matter, Form, Agent and Purpose.

Matter is what constitutes the outcome. For a chair it might be wood. For a statue, it might be marble. The outcome is determined by what constitutes the outcome.
Form refers to the shape of the outcome. Thus, a carpenter or a sculptor would have a pre-conceived notion of the shape of the outcome and they would design toward that artifact.
Agent refers to the efficient cause or the act of producing the outcome. Carpentry or masonry skills would be important to shape the final outcome.
Finally, the outcome itself must serve a purpose on its own. For a chair, it might be something to sit on, for a statue it might be something to be marveled at.
However, Aristotle also admits that luck and chance can play an important role that do not fit the causal framework in its own right. Some things do happen by chance or luck. Chance is a rare event, it is a random event and it is typically brought out by some purposeful action or by nature.

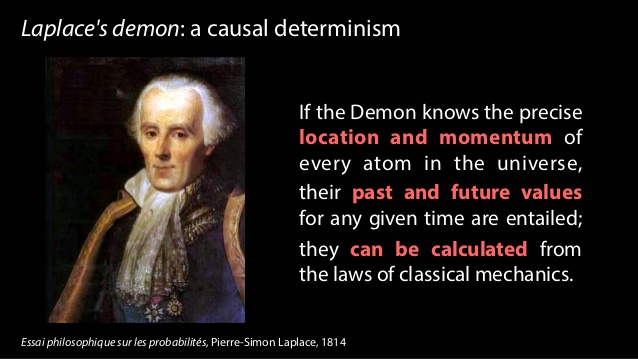
We had briefly discussed the Laplace demon and he summarized this wonderfully: “We ought then to consider the resent state of the universe as the effect of its previous state and as the cause of that which is to follow. An intelligence that, at a given instant, could comprehend all the forces by which nature is animated and the respective situation of the beings that make it up if moreover it were vast enough to submit these data to analysis, would encompass in the same formula the movements of the greatest bodies of the universe and those of the lightest atoms. For such an intelligence nothing would be uncertain, and the future, like the past, would be open to its eyes.” He thus admits to the fact that we lack the vast intelligence and we are forced to use probabilities in order to get a sense of understanding of dynamical systems.
It was Maxwell in his pivotal book “Matter and Motion” published in 1876 lay the groundwork of chaos theory.
“There is a maxim which is often quoted, that “the same causes will always produce the same effects.’ To make this maxim intelligible we must define what we mean by the same causes and the same effects, since it is manifest that no event ever happens more than once, so that the causes and effects cannot be the same in all respects. There is another maxim which must not be confounded with that quoted at the beginning of this article, which asserts “That like causes produce like effects.” This is only true when small variations in the initial circumstances produce only small variations in the final state of the system. In a great many physical phenomena this condition is satisfied: but there are other cases in which a small initial variation may produce a great change in the final state of the system, as when the displacement of the points cause a railway train to run into another instead of keeping its proper course.” What is interesting however in the above quote is that Maxwell seems to go with the notion that in a great many cases there is no sensitivity to initial conditions.

In the 1890’s Henri Poincare was the first exponent of chaos theory. He says “it may happen that small differences in the initial conditions produce very great ones in the final phenomena. A small error in the former will produce an enormous error in the latter. Prediction becomes impossible.” This was a far cry from the Newtonian world which sought order on how the solar system worked. Newton’s model was posted on the basis of the interaction between just two bodies. What would then happen if three bodies or N bodies were introduced into the model. This led to the rise of the Three Body Problem which led to Poincare embracing the notion that this problem could not be solved and can be tackled by approximate numerical techniques. Solving this resulted in solutions that were so tangled that is was difficult to not only draw them, it was near impossible to derive equations to fit the results. In addition, Poincare also discovered that if the three bodies started from slightly different initial positions, the orbits would trace out different paths. This led to Poincare forever being designated as the Father of Chaos Theory since he laid the groundwork on the most important element in chaos theory which is the sensitivity to initial dependence.
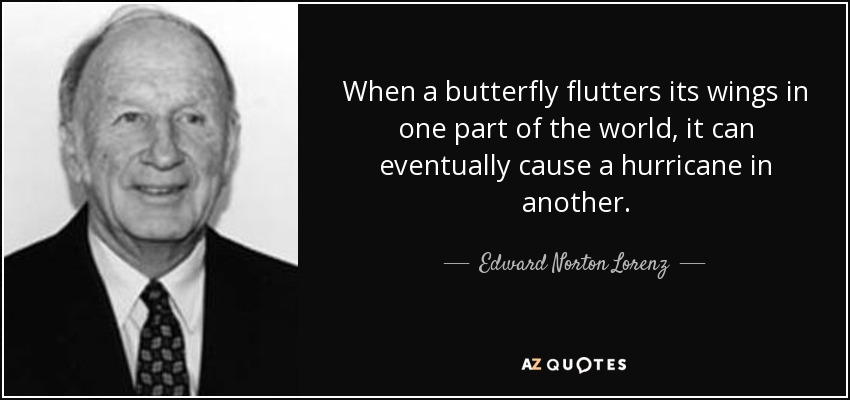
In the early 1960’s, the first true experimenter in chaos was a meteorologist named Edward Lorenz. He was working on a problem in weather prediction and he set up a system with twelve equations to model the weather. He set the initial conditions and the computer was left to predict what the weather might be. Upon revisiting this sequence later on, he inadvertently and by sheer accident, decided to run the sequence again in the middle and he noticed that the outcome was significantly different. The imminent question that followed was why the outcome was so different than the original. He traced this back to the initial condition wherein he noted that the initial input was different with respect to the decimal places. The system incorporated the all of the decimal places rather than the first three. (He had originally input the number .506 and he had concatenated the number from .506127). He would have expected that this thin variation in input would have created a sequence close to the original sequence but that was not to be: it was distinctly and hugely different. This effect became known as the Butterfly effect which is often substituted for Chaos Theory. Ian Stewart in his book, Does God Play Dice? The Mathematics of Chaos, describes this visually as follows:
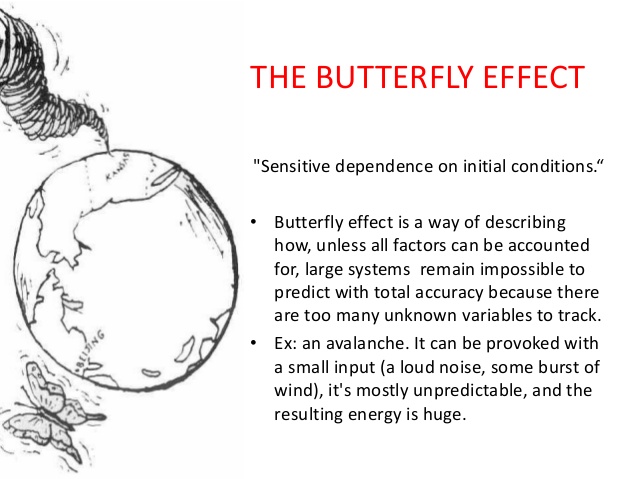
“The flapping of a single butterfly’s wing today produces a tiny change in the state of the atmosphere. Over a period of time, what the atmosphere actually does diverges from what it would have done. So, in a month’s time, a tornado that would have devastated the Indonesian cost doesn’t happen. Or maybe one that wasn’t going to happen, does.”
Lorenz thus argued that it would be impossible to predict the weather accurately. However, he reduced his experiment to fewer set of equations and took upon observations of how small change in initial conditions affect predictability of smaller systems. He found a parallel – namely, that changes in initial conditions tends to render the final outcome of a system to be inaccurate. As he looked at alternative systems, he found a strange pattern that emerged – namely, that the system always represented a double spiral – the system never settled down to a single point but they never repeated its trajectory. It was a path breaking discovery that led to further advancement in the science of chaos in later years.
Years later, Robert May investigated how this impacts population. He established an equation that reflected a population growth and initialized the equation with a parameter for growth rate value. (The growth rate was initialized to 2.7). May found that as he increased the parameter value, the population grew which was expected. However, once he passed the 3.0 growth value, he noticed that equation would not settle down to a single population but branch out to two different values over time. If he raised the initial value more, the bifurcation or branching of the population would be twice as much or four different values. If he continued to increase the parameter, the lines continue to double until chaos appeared and it became hard to make point predictions.
There was another innate discovery that occurred through the experiment. When one visually looks at the bifurcation, one tends to see similarity between the small and large branches. This self-similarity became an important part of the development of chaos theory.
Benoit Mandelbrot started to study this self-similarity pattern in chaos. He was an economist and he applied mathematical equations to predict fluctuations in cotton prices. He noted that particular price changes were not predictable but there were certain patterns that were repeated and the degree of variation in prices had remained largely constant. This is suggestive of the fact that one might, upon preliminary reading of chaos, arrive at the notion that if weather cannot be predictable, then how can we predict climate many years out. On the contrary, Mandelbrot’s experiments seem to suggest that short time horizons are difficult to predict that long time horizon impact since systems tend to settle into some patterns that is reflecting of smaller patterns across periods. This led to the development of the concept of fractal dimensions, namely that sub-systems develop a symmetry to a larger system.
Feigenbaum was a scientist who became interested in how quickly bifurcations occur. He discovered that regardless of the scale of the system, the came at a constant rate of 4.669. If you reduce or enlarge the scale by that constant, you would see the mechanics at work which would lead to an equivalence in self-similarity. He applied this to a number of models and the same scaling constant took effect. Feigenbaum had established, for the first time, a universal constant around chaos theory. This was important because finding a constant in the realm of chaos theory was suggestive of the fact that chaos was an ordered process, not a random one.
Sir James Lighthill gave a lecture and in that he made an astute observation –
“We are all deeply conscious today that the enthusiasm of our forebears for the marvelous achievements of Newtonian mechanics led them to make generalizations in this area of predictability which, indeed, we may have generally tended to believe before 1960, but which we now recognize were false. We collectively wish to apologize for having misled the general educated public by spreading ideas about determinism of systems satisfying Newton’s laws of motion that, after 1960, were to be proved incorrect.”

Managing Scale
| I think the most difficult thing had been scaling the infrastructure. Trying to support the response we had received from our users and the number of people that were interested in using the software. – Shawn Fanning |
Froude’s number? It is defined as the square of the ship’s velocity divided by its length and multiplied by the acceleration caused by gravity. So why are we introducing ships in this chapter? As I have done before, I am liberally standing on the shoulder of the giant, Geoffrey West, and borrowing from his account on the importance of the Froude’s number and the practical implications. Since ships are subject to turbulence, using a small model that works in a simulated turbulent environment might not work when we manufacture a large ship that is facing the ebbs and troughs of a finicky ocean. The workings and impact of turbulence is very complex, and at scale it becomes even more complex. Froude’s key contribution was to figure out a mathematical pathway of how to efficiently and effectively scale from a small model to a practical object. He did that by using a ratio as the common denominator. Mr. West provides an example that hits home: How fast does a 10-foot-long ship have to move to mimic the motion of a 700-foot-long ship moving at 20 knots. If they are to have the same Froude number (that is, the same value of the square of their velocity divided by their length), then the velocity has to scale as the square root of their lengths. The ratio of the square root of their lengths is the the square of 700 feet of the ship/10 feet of the model ship which turns out to be the square of 70. For the 10-foot model to mimic the motion of a large ship, it must move at the speed of 20 knots/ square of 70 or 2.5 knots. The Froude number is still widely used across many fields today to bridge small scale and large-scale thinking. Although this number applies to physical systems, the notion that adaptive systems can be similarly bridged through appropriate mathematical equations. Unfortunately, because of the increased number of variables impacting adaptive systems and all of these variables working and learning from one another, the task of establishing a Froude number becomes diminishingly small.

The other concept that has gained wide attention is the science of allometry. Allometry essentially states that as size increases, then the form of the object would change. Allometric scaling governs all complex physical and adaptive systems. So the question is whether there are some universal laws or mathematics that can be used to enable us to better understand or predict scale impacts. Let us extend this thinking a bit further. If sizes influence form and form constitute all sub-physical elements, then it would stand to reason that a universal law or a set of equations can provide deep explanatory powers on scale and systems. One needs to bear in mind that even what one might consider a universal law might be true within finite observations and boundaries. In other words, if there are observations that fall outside of those boundaries, one is forced into resetting our belief in the universal law or to frame a new paradigm to cover these exigencies. I mention this because as we seek to understand business and global grand challenges considering the existence of complexity, scale, chaos and seeming disorder – we might also want to embrace multiple laws or formulations working at different hierarchies and different data sets to arrive at satisficing solutions to the problems that we want to wrestle with.
Physics and mathematics allow a qualitatively high degree of predictability. One can craft models across different scales to make a sensible approach on how to design for scale. If you were to design a prototype using a 3D printer and decide to scale that prototype a 100X, there are mathematical scalar components that are factored into the mechanics to allow for some sort of equivalence which would ultimately lead to the final product fulfilling its functional purpose in a complex physical system. But how does one manage scale in light of those complex adaptive systems that emerge due to human interactions, evolution of organization, uncertainty of the future, and dynamic rules that could rapidly impact the direction of a company?
Is scale a single measure? Or is it a continuum? In our activities, we intentionally or unintentionally invoke scale concepts. What is the most efficient scale to measure an outcome, so we can make good policy decisions, how do we apply our learning from one scale to a system that operates on another scale and how do we assess how sets of phenomena operate at different scales, spatially and temporally, and how they impact one another? Now the most interesting question: Is scale polymorphous? Does the word scale have different meanings in different contexts? When we talk about microbiology, we are operating at micro-scales. When we talk at a very macro level, our scales are huge. In business, we regard scale with respect to how efficiently we grow. In one way, it is a measure but for the following discussion, we will interpret scale as non-linear growth expending fewer and fewer resources to support that growth as a ratio.

As we had discussed previously, complex adaptive systems self-organize over time. They arrive at some steady state outcome without active intervention. In fact, the active intervention might lead to unintended consequences that might even spell doom for the system that is being influenced. So as an organization scales, it is important to keep this notion of rapid self-organization in mind which will inform us to make or not make certain decisions from a central or top-down perspective. In other words, part of managing scale successfully is to not manage it at a coarse-grained level.
The second element of successfully managing scale is to understand the constraints that prevent scale. There is an entire chapter dedicated to the theory of constraints which sheds light on why this is a fundamental process management technique that increases the pace of the system. But for our purposes in this section, we will summarize as follows: every system as it grows have constraints. It is important to understand the constraints because these constraints slow the system: the bottlenecks have to be removed. And once one constraint is removed, then one comes across another constraint. The system is a chain of events and it is imperative that all of these events are identified. The weakest links harangue the systems and these weakest links have to be either cleared or resourced to enable the system to scale. It is a continuous process of observation and tweaking the results with the established knowledge that the demons of uncertainty and variability can reset the entire process and one might have to start again. Despite that fact, constraint management is an effective method to negotiate and manage scale.

The third element is devising the appropriate organization architecture. As one projects into the future, management might be inclined toward developing and investing in the architecture early to accommodate the scale. Overinvestment in the architecture might not be efficient. As mentioned, cities and social systems that grow 100% require 85% investment in infrastructure: in other words, systems grow on a sublinear scale from an infrastructure perspective. How does management of scale arrive at the 85%? It is nigh impossible, but it is important to reserve that concept since it informs management to architect the infrastructure cautiously. Large investments upfront could be a waste or could slow the system down: alternative, investments that are postponed a little too late can also impact the system adversely.
The fourth element of managing scale is to focus your lens of opportunity. In macroecology, we can arrive at certain conclusions when we regard the system from a distance versus very closely. We can subsume our understanding into one big bucket called climate change and then we figure out different ways to manage the complexity that causes the climate change by invoking certain policies and incentives at a macro level. However, if we go closer, we might decide to target a very specific contributor to climate change – namely, fossil fuels. The theory follows that to manage the dynamic complexity and scale of climate impact – it would be best to address a major factor which, in this case, would be fossil fuels. The equivalence of this in a natural business setting would be to establish and focus the strategy for scale in a niche vertical or a relatively narrower set of opportunities. Even though we are working in the web of complex adaptive systems, we might devise strategies to directionally manage the business within the framework of complex physical systems where we have an understanding of the slight variations of initial state and the realization that the final outcome might be broad but yet bounded for intentional management.

The final element is the management of initial states. Complex physical systems are governed by variation in initial states. Perturbation of these initial states can lead to a wide divergence of outcomes, albeit bounded within a certain frame of reference. It is difficult perhaps to gauge all the interactions that might occur from a starting point to the outcome, although we agree that a few adjustments like decentralization of decision making, constraint management, optimal organization structure and narrowing the playing field would be helpful.
Scaling Considerations in Complex Systems and Organizations: Implications
Scale represents size. In a two-dimensional world, it is a linear measurement that presents a nominal ordering of numbers. In other words, 4 is two times two and 6 would be 3 times two. In other words, the difference between 4 and 6 represents an increase in scale by two. We will discuss various aspects of scale and the learnings that we can draw from it. However, before we go down this path, we would like to touch on resource consumption.

As living organisms, we consume resources. An average human being requires 2000 calories of food per day to sustain themselves. An average human being, by the way, is largely defined in terms of size. So it would be better put if we say that a 200lb person would require 2000 calories. However, if we were to regard a specimen that is 10X the size or 2000 lbs., would it require 10X the calories to sustain itself? Conversely, if the specimen was 1/100th the size of the average human being, then would it require 1/100th the calories to sustain itself. Thus, will we consume resources linearly to our size? Are we operating in a simple linear world? And if not, what are the ramifications for science, physics, biology, organizations, cities, climate, etc.?
Let us digress a little bit from the above questions and lay out a few interesting facts. Almost half of the population in the world today live in cities. This is compared to less than 15% of the world population that lived in cities a hundred years ago. It is anticipated that almost 75% of the world population will be living in cities by 2050. The number of cities will increase and so will the size. But for cities to increase in size and numbers, it requires vast amount of resources. In fact, the resource requirements in cities are far more extensive than in agrarian societies. If there is a limit to the resources from a natural standpoint – in other words, if the world is operating on a budget of natural resources – then would this mean that the growth of the cities will be naturally reined in? Will cities collapse because of lack of resources to support its mass?
What about companies? Can companies grow infinitely? Is there a natural point where companies might hit their limit beyond which growth would not be possible? Could a company collapse because the amount of resources that is required to sustain the size would be compromised? Are there other factors aside from resource consumption that play into what might cap the growth and hence the size of the company? Are there overriding factors that come into play that would superimpose the size-resource usage equation such that our worries could be safely kept aside? Are cities and companies governed by some sort of metabolic rate that governs the sustenance of life?
Geoffrey West, a theoretical physicist, has touched on a lot of the questions in his book: Scale: The Universal Laws of Growth, Innovation, Sustainability, and the Pace of Life in Organisms, Cities, Economies, and Companies. He says that a person requires about 90W (watts) of energy to survive. That is a light bulb burning in your living room in one day. That is our metabolic rate. However, just like man does not live by bread alone, an average man has to depend on a number of other artifacts that have agglomerated in bits and pieces to provide a quality of life to maximize sustenance. The person has to have laws, electricity, fuel, automobile, plumbing and water, markets, banks, clothes, phones and engage with other folks in a complex social network to collaborate and compete to achieve their goals. Geoffrey West says that the average person requires almost 11000W or the equivalent of almost 125 90W light bulbs. To put things in greater perspective, the social metabolic rate of 11,000W is almost equivalent to a dozen elephants. (An elephant requires 10X more energy than humans even though they might be 60X the size of the physical human being). Thus, a major portion of our energy is diverted to maintain the social and physical network that closely interplay to maintain our sustenance. And while we consume massive amounts of energy, we also create a massive amount of waste – and that is an inevitable outcome. This is called the entropy impact and we will touch on this in greater detail in later articles. Hence, our growth is not only constrained by our metabolic rate: it is further dampened by entropy that exists as the Second Law of Thermodynamics. And as a system ages, the impact of entropy increases manifold. Yes, it is true: once we get old, we are racing toward our death at a faster pace than when we were young. Our bodies are exhibiting fatigue faster than normal.
Scaling refers to how a system responds when its size changes. As mentioned earlier, does scaling follow a linear model? Do we need to consume 2X resources if we increase the size by 2X? How does scaling impact a Complex Physical System versus a Complex Adaptive System? Will a 2X impact on the initial state create perturbations in a CPS model which is equivalent to 2X? How would this work on a CAS model where the complexity is far from defined and understood because these systems are continuously evolving? Does half as big requires half as much or conversely twice as big requires twice as much? Once again, I have liberally dipped into this fantastic work by Geoffrey West to summarize, as best as possible, the definitions and implications. He proves that we cannot linearly extrapolate energy consumption and size: the world is smattered with evidence that undermines the linear extrapolation model. In fact, as you grow, you become more efficient with respect to energy consumption. The savings of energy due to growth in size is commonly called the economy of scale. His research also suggests two interesting results. When cities or social systems grow, they require an infrastructure to help with the growth. He discovered that it takes 85% resource consumption to grow the systems by 100%. Thus, there is a savings of 15% which is slightly lower than what has been studied on the biological front wherein organisms save 25% as they grow. He calls this sub linear scaling. In contrast, he also introduces the concept of super linear scaling wherein there is a 15% increasing returns to scale when the city or a social system grows. In other words, if the system grows by 100%, the positive returns with respect to such elements like patents, innovation, etc. will grow by 115%. In addition, the negative elements also grow in an equivalent manner – crime, disease, social unrest, etc. Thus, the growth in cities are supported by an efficient infrastructure that generates increasing returns of good and bad elements.
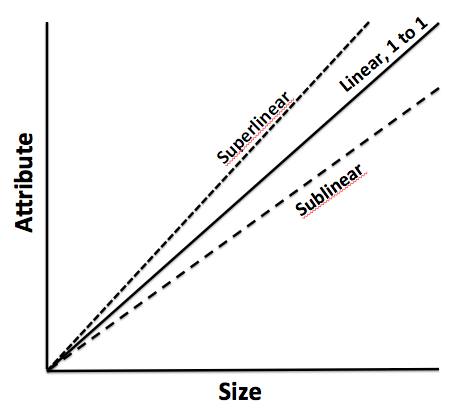
Max Kleiber, a Swiss chemist, in the 1930’s proposed the Kleiber’s law which sheds a lot of light on metabolic rates as energy consumption per unit of time. As mass increases so does the overall metabolic rate but it is not a linear relation – it obeys the power law. It stays that a living organism’s metabolic rate scales to the ¾ power of its mass. If the cat has a mass 100 times that of a mouse, the cat will metabolize about 100 ¾ = 31.63 times more energy per day rather than 100 times more energy per day. Kleiber’s law has led to the metabolic theory of energy and posits that the metabolic rate of organisms is the fundamental biological rate that governs most observed patters in our immediate ecology. There is some ongoing debate on the mechanism that allows metabolic rate to differ based on size. One mechanism is that smaller organisms have higher surface area to volume and thus needs relatively higher energy versus large organisms that have lower surface area to volume. This assumes that energy consumption occurs across surface areas. However, there is another mechanism that argues that energy consumption happens when energy needs are distributed through a transport network that delivers and synthesizes energy. Thus, smaller organisms do not have as a rich a network as large organisms and thus there is greater energy efficiency usage among smaller organisms than larger organisms. Either way, the implications are that body size and temperature (which is a result of internal activity) provide fundamental and natural constraints by which our ecological processes are governed. This leads to another concept called finite time singularity which predicts that unbounded growth cannot be sustained because it would need infinite resources or some K factor that would allow it to increase. The K factor could be innovation, a structural shift in how humans and objects cooperate, or even a matter of jumping on a spaceship and relocating to Mars.
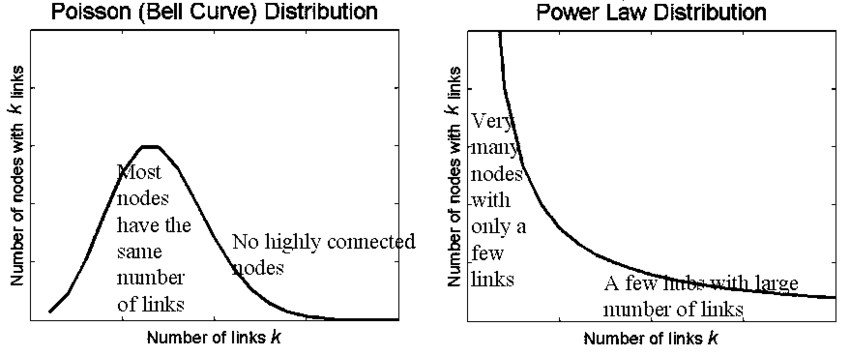
We are getting bigger faster. That is real. The specter of a dystopian future hangs upon us like the sword of Damocles. The thinking is that this rate of growth and scale is not sustainable since it is impossible to marshal the resources to feed the beast in an adequate and timely manner. But interestingly, if we were to dig deeper into history – these thoughts prevailed in earlier times as well but perhaps at different scale. In 1798 Thomas Robert Malthus famously predicted that short-term gains in living standards would inevitably be undermined as human population growth outstripped food production, and thereby drive living standards back toward subsistence. Humanity thus was checkmated into an inevitable conclusion: a veritable collapse spurred by the tendency of population to grow geometrically while food production would increase only arithmetically. Almost two hundred years later, a group of scientists contributed to the 1972 book called Limits to Growth which had similar refrains like Malthus: the population is growing and there are not enough resources to support the growth and that would lead to the collapse of our civilization. However, humanity has negotiated those dark thoughts and we continue to prosper. If indeed, we are governed by this finite time singularity, we are aware that human ingenuity has largely won the day. Technology advancements, policy and institutional changes, new ways of collaboration, etc. have emerged to further delay this “inevitable collapse” that could be result of more mouths to feed than possible. What is true is that the need for new innovative models and new ways of doing things to solve the global challenges wrought by increased population and their correspondent demands will continue to increase at a quicker pace. Once could thus argue that the increased pace of life would not be sustainable. However, that is not a plausible hypothesis based on our assessment of where we are and where we have been.
Let us turn our attention to a business. We want the business to grow or do we want the business to scale? What is the difference? To grow means that your company is adding resources or infrastructure to handle increased demand, at a cost which is equivalent to the level of increased revenue coming in. Scaling occurs when the business is growing faster than the resources that are being consumed. We have already explored that outlier when you grow so big that you are crushed by your weight. It is that fact which limits the growth of organism regardless of issues related to scale. Similarly, one could conceivably argue that there are limits to growth of a company and might even turn to history and show that a lot of large companies of yesteryears have collapsed. However, it is also safe to say that large organizations today are by several factors larger than the largest organizations in the past, and that is largely on account of accumulated knowledge and new forms of innovation and collaboration that have allowed that to happen. In other words, the future bodes well for even larger organizations and if those organizations indeed reach those gargantuan size, it is also safe to draw the conclusion that they will be consuming far less resources relative to current organizations, thus saving more energy and distributing more wealth to the consumers.
Thus, scaling laws limit growth when it assumes that everything else is constant. However, if there is innovation that leads to structural changes of a system, then the limits to growth becomes variable. So how do we effect structural changes? What is the basis? What is the starting point? We look at modeling as a means to arrive at new structures that might allow the systems to be shaped in a manner such that the growth in the systems are not limited by its own constraints of size and motion and temperature (in physics parlance). Thus, a system is modeled at a presumably small scale but with the understanding that as the system is increases in size, the inner workings of emergent complexity could be a problem. Hence, it would be prudent to not linearly extrapolate the model of a small system to that of a large one but rather to exponential extrapolate the complexity of the new system that would emerge. We will discuss this in later articles, but it would be wise to keep this as a mental note as we forge ahead and refine our understanding of scale and its practical implications for our daily consumption.
Model Thinking
| Model Framework |
The fundamental tenet of theory is the concept of “empiria“. Empiria refers to our observations. Based on observations, scientists and researchers posit a theory – it is part of scientific realism.
A scientific model is a causal explanation of how variables interact to produce a phenomenon, usually linearly organized. A model is a simplified map consisting of a few, primary variables that is gauged to have the most explanatory powers for the phenomenon being observed. We discussed Complex Physical Systems and Complex Adaptive Systems early on this chapter. It is relatively easier to map CPS to models than CAS, largely because models become very unwieldy as it starts to internalize more variables and if those variables have volumes of interaction between them. A simple analogy would be the use of multiple regression models: when you have a number of independent variables that interact strongly between each other, autocorrelation errors occur, and the model is not stable or does not have predictive value.

Research projects generally tend to either look at a case study or alternatively, they might describe a number of similar cases that are logically grouped together. Constructing a simple model that can be general and applied to many instances is difficult, if not impossible. Variables are subject to a researcher’s lack of understanding of the variable or the volatility of the variable. What further accentuates the problem is that the researcher misses on the interaction of how the variables play against one another and the resultant impact on the system. Thus, our understanding of our system can be done through some sort of model mechanics but, yet we share the common belief that the task of building out a model to provide all of the explanatory answers are difficult, if not impossible. Despite our understanding of our limitations of modeling, we still develop frameworks and artifact models because we sense in it a tool or set of indispensable tools to transmit the results of research to practical use cases. We boldly generalize our findings from empiria into general models that we hope will explain empiria best. And let us be mindful that it is possible – more so in the CAS systems than CPS that we might have multiple models that would fight over their explanatory powers simply because of the vagaries of uncertainty and stochastic variations.
Popper says: “Science does not rest upon rock-bottom. The bold structure of its theories rises, as it were, above a swamp. It is like a building erected on piles. The piles are driven down from above into the swamp, but not down to any natural or ‘given’ base; and when we cease our attempts to drive our piles into a deeper layer, it is not because we have reached firm ground. We simply stop when we are satisfied that they are firm enough to carry the structure, at least for the time being”. This leads to the satisficing solution: if a model can choose the least number of variables to explain the greatest amount of variations, the model is relatively better than other models that would select more variables to explain the same. In addition, there is always a cost-benefit analysis to be taken into consideration: if we add x number of variables to explain variation in the outcome but it is not meaningfully different than variables less than x, then one would want to fall back on the less-variable model because it is less costly to maintain.
Researchers must address three key elements in the model: time, variation and uncertainty. How do we craft a model which reflects the impact of time on the variables and the outcome? How to present variations in the model? Different variables might vary differently independent of one another. How do we present the deviation of the data in a parlance that allows us to make meaningful conclusions regarding the impact of the variations on the outcome? Finally, does the data that is being considered are actual or proxy data? Are the observations approximate? How do we thus draw the model to incorporate the fuzziness: would confidence intervals on the findings be good enough?
Two other equally other concepts in model design is important: Descriptive Modeling and Normative Modeling.
Descriptive models aim to explain the phenomenon. It is bounded by that goal and that goal only.
There are certain types of explanations that they fall back on: explain by looking at data from the past and attempting to draw a cause and effect relationship. If the researcher is able to draw a complete cause and effect relationship that meets the test of time and independent tests to replicate the results, then the causality turns into law for the limited use-case or the phenomenon being explained. Another explanation method is to draw upon context: explaining a phenomenon by looking at the function that the activity fulfills in its context. For example, a dog barks at a stranger to secure its territory and protect the home. The third and more interesting type of explanation is generally called intentional explanation: the variables work together to serve a specific purpose and the researcher determines that purpose and thus, reverse engineers the understanding of the phenomenon by understanding the purpose and how the variables conform to achieve that purpose.
This last element also leads us to thinking through the other method of modeling – namely, normative modeling. Normative modeling differs from descriptive modeling because the target is not to simply just gather facts to explain a phenomenon, but rather to figure out how to improve or change the phenomenon toward a desirable state. The challenge, as you might have already perceived, is that the subjective shadow looms high and long and the ultimate finding in what would be a normative model could essentially be a teleological representation or self-fulfilling prophecy of the researcher in action. While this is relatively more welcome in a descriptive world since subjectivism is diffused among a larger group that yields one solution, it is not the best in a normative world since variation of opinions that reflect biases can pose a problem.
How do we create a representative model of a phenomenon? First, we weigh if the phenomenon is to be understood as a mere explanation or to extend it to incorporate our normative spin on the phenomenon itself. It is often the case that we might have to craft different models and then weigh one against the other that best represents how the model can be explained. Some of the methods are fairly simple as in bringing diverse opinions to a table and then agreeing upon one specific model. The advantage of such an approach is that it provides a degree of objectivism in the model – at least in so far as it removes the divergent subjectivity that weaves into the various models. Other alternative is to do value analysis which is a mathematical method where the selection of the model is carried out in stages. You define the criteria of the selection and then the importance of the goal (if that be a normative model). Once all of the participants have a general agreement, then you have the makings of a model. The final method is to incorporate all all of the outliers and the data points in the phenomenon that the model seeks to explain and then offer a shared belief into those salient features in the model that would be best to apply to gain information of the phenomenon in a predictable manner.
There are various languages that are used for modeling:
Written Language refers to the natural language description of the model. If price of butter goes up, the quantity demanded of the butter will go down. Written language models can be used effectively to inform all of the other types of models that follow below. It often goes by the name of “qualitative” research, although we find that a bit limiting. Just a simple statement like – This model approximately reflects the behavior of people living in a dense environment …” could qualify as a written language model that seeks to shed light on the object being studied.
Icon Models refer to a pictorial representation and probably the earliest form of model making. It seeks to only qualify those contours or shapes or colors that are most interesting and relevant to the object being studied. The idea of icon models is to pictorially abstract the main elements to provide a working understanding of the object being studied.
Topological Models refer to how the variables are placed with respect to one another and thus helps in creating a classification or taxonomy of the model. Once can have logical trees, class trees, Venn diagrams, and other imaginative pictorial representation of fields to further shed light on the object being studied. In fact, pictorial representations must abide by constant scale, direction and placements. In other words, if the variables are placed on a different scale on different maps, it would be hard to draw logical conclusions by sight alone. In addition, if the placements are at different axis in different maps or have different vectors, it is hard to make comparisons and arrive at a shared consensus and a logical end result.
Arithmetic Models are what we generally fall back on most. The data is measured with an arithmetic scale. It is done via tables, equations or flow diagrams. The nice thing about arithmetic models is that you can show multiple dimensions which is not possible with other modeling languages. Hence, the robustness and the general applicability of such models are huge and thus is widely used as a key language to modeling.
Analogous Models refer to crafting explanations using the power of analogy. For example, when we talk about waves – we could be talking of light waves, radio waves, historical waves, etc. These metaphoric representations can be used to explain phenomenon, but at best, the explanatory power is nebulous, and it would be difficult to explain the variations and uncertainties between two analogous models. However, it still is used to transmit information quickly through verbal expressions like – “Similarly”, “Equivalently”, “Looks like ..” etc. In fact, extrapolation is a widely used method in modeling and we would ascertain this as part of the analogous model to a great extent. That is because we time-box the variables in the analogous model to one instance and the extrapolated model to another instance and we tie them up with mathematical equations.
The Law of Unintended Consequences
The Law of Unintended Consequence is that the actions of a central body that might claim omniscient, omnipotent and omnivalent intelligence might, in fact, lead to consequences that are not anticipated or unintended.
The concept of the Invisible Hand as introduced by Adam Smith argued that it is the self-interest of all the market agents that ultimately create a system that maximizes the good for the greatest amount of people.
Robert Merton, a sociologist, studied the law of unintended consequence. In an influential article titled “The Unanticipated Consequences of Purposive Social Action,” Merton identified five sources of unanticipated consequences.
Ignorance makes it difficult and impossible to anticipate the behavior of every element or the system which leads to incomplete analysis.
Errors that might occur when someone uses historical data and applies the context of history into the future. Linear thinking is a great example of an error that we are wrestling with right now – we understand that there are systems, looking back, that emerge exponentially but it is hard to decipher the outcome unless one were to take a leap of faith.
Biases work its way into the study as well. We study a system under the weight of our biases, intentional or unintentional. It is hard to strip that away even if there are different bodies of thought that regard a particular system and how a certain action upon the system would impact it.
Weaved with the element of bias is the element of basic values that may require or prohibit certain actions even if the long-term impact is unfavorable. A good example would be the toll gates established by the FDA to allow drugs to be commercialized. In its aim to provide a safe drug, the policy might be such that the latency of the release of drugs for experiments and commercial purposes are so slow that many patients who might otherwise benefit from the release of the drug lose out.
Finally, he discusses the self-fulfilling prophecy which suggests that tinkering with the elements of a system to avert a catastrophic negative event might in actuality result in the event.
It is important however to acknowledge that unintended consequences do not necessarily lead to a negative outcome. In fact, there are could be unanticipated benefits. A good example is Viagra which started off as a pill to lower blood pressure, but one discovered its potency to solve erectile dysfunctions. The discovery that ships that were sunk became the habitat and formation of very rich coral reefs in shallow waters that led scientists to make new discoveries in the emergence of flora and fauna of these habitats.
If there are initiatives exercised that are considered “positive initiative” to influence the system in a manner that contribute to the greatest good, it is often the case that these positive initiatives might prove to be catastrophic in the long term. Merton calls the cause of this unanticipated consequence as something called the product of the “relevance paradox” where decision makers thin they know their areas of ignorance regarding an issue, obtain the necessary information to fill that ignorance gap but intentionally or unintentionally neglect or disregard other areas as its relevance to the final outcome is not clear or not lined up to values. He goes on to argue, in a nutshell, that unintended consequences relate to our hubris – we are hardwired to put our short-term interest over long term interest and thus we tinker with the system to surface an effect which later blow back in unexpected forms. Albert Camus has said that “The evil in the world almost always comes of ignorance, and good intentions may do as much harm as malevolence if they lack understanding.”
An interesting emergent property that is related to the law of unintended consequence is the concept of Moral Hazard. It is a concept that individuals have incentives to alter their behavior when their risk or bad decision making is borne of diffused among others. For example:
If you have an insurance policy, you will take more risks than otherwise. The cost of those risks will impact the total economics of the insurance and might lead to costs being distributed from the high-risk takers to the low risk takers.

How do the conditions of the moral hazard arise in the first place? There are two important conditions that must hold. First, one party has more information than another party. The information asymmetry thus creates gaps in information and that creates a condition of moral hazard. For example, during 2006 when sub-prime mortgagors extended loans to individuals who had dubitable income and means to pay. The Banks who were buying these mortgages were not aware of it. Thus, they ended up holding a lot of toxic loans due to information asymmetry. Second, is the existence of an understanding that might affect the behavior of two agents. If a child knows that they are going to get bailed out by the parents, he/she might take some risks that he/she would otherwise might not have taken.
To counter the possibility of unintended consequences, it is important to raise our thinking to second-order thinking. Most of our thinking is simplistic and is based on opinions and not too well grounded in facts. There are a lot of biases that enter first order thinking and in fact, all of the elements that Merton touches on enters it – namely, ignorance, biases, errors, personal value systems and teleological thinking. Hence, it is important to get into second-order thinking – namely, the reasoning process is surfaced by looking at interactions of elements, temporal impacts and other system dynamics. We had mentioned earlier that it is still difficult to fully wrestle all the elements of emergent systems through the best of second-order thinking simply because the dynamics of a complex adaptive system or complex physical system would deny us that crown of competence. However, this fact suggests that we step away from simple, easy and defendable heuristics to measure and gauge complex systems.
Emergent Systems: Introduction
The whole is greater than the sum of its parts. “Emergent properties” refer to those properties that emerge that might be entirely unexpected. As discussed in CAS, they arise from the collaborative functioning of a system. In other words, emergent properties are properties of a group of items, but it would be erroneous for us to reduce such systems into properties of atomic elements and use those properties as binding elements to understand emergence Some common examples of emergent properties include cities, bee hives, ant colonies and market systems. Out thinking attributes causal effects – namely, that behavior of elements would cause certain behaviors in other hierarchies and thus an entity emerges at a certain state. However, we observe that a process of emergence is the observation of an effect without an apparent cause. Yet it is important to step back and regard the relationships and draw lines of attribution such that one can concur that there is an impact of elements at the lowest level that surfaces, in some manner, at the highest level which is the subject of our observation.

Jochenn Fromm in his paper “Types and Forms of Emergence” has laid this out best. He says that emergent properties are “amazing and paradox: fundamental but familiar.” In other words, emergent properties are changeless and changing, constant and fluctuating, persistent and shifting, inevitable and unpredictable. The most important note that he makes is that the emergent property is part of the system and at the same time it might not always be a part of the system. There is an undercurrent of novelty or punctuated gaps that might arise that is inexplicable, and it is this fact that renders true emergence virtually irreducible. Thus, failure is embodied in all emergent systems – failure being that the system does not behave according to expectation. Despite all rules being followed and quality thresholds are established at every toll gate at the highest level, there is still a possibility of failure which suggests that there is some missing information in the links. It is also possible that the missing information is dynamic – you do not step in the same water twice – which makes the study to predict emergent systems to be a rather difficult exercise. Depending on the lens through which we look at, the system might appear or disappear.
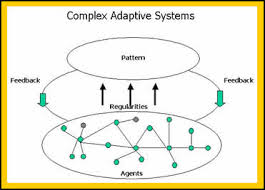
There are two types of emergence: Descriptive and Explanatory emergence. Descriptive emergence means that properties of wholes cannot be necessarily defined through the properties of the pasts. Explanatory emergence means laws of complex systems cannot be deduced from the laws of interaction of simpler elements that constitute it. Thus the emergence is a result of the amount of variety embodied in the system, the amount of external influence that weights and shapes the overall property and direction of the system, the type of resources that the system consumes, the type of constraints that the system is operating under and the number of levels of sub-systems that work together to build out the final system. Thus, systems can be benign as in the system is relatively more predictable whereas a radical system is a material departure of a system from expectation. If the parts that constitute a system is independent of its workings from other parts and can be boxed within boundaries, emergent systems become more predictable. A watch is an example of a system that follows the different mechanical elements in a watch that are geared for reading the time as it ultimate purpose. It is a good example of a complex physical system. However, these systems are very brittle – a failure in one point can cascade into a failure of the entire system. Systems that are more resilient are those where the elements interact and learn from one another. In other words, the behavior of the elements excites other elements – all of which work together to create a dance toward a more stable state. They deploy what is often called the flocking trick and the pheromone trick. Flocking trick is largely the emulation of the particles that are close to each other – very similar to the cellular automata as introduced by Neumann and discussed in the earlier chapter. The Pheromone trick reflects how the elements leave marks that are acted upon as signals by other elements and thus they all work together around these signal trails to behave and thus act as a forcing function to create the systems.
There are systems that have properties of extremely strong emergence. What does Consciousness, Life, and Culture have in common? How do we look at Climate? What about the organic development of cities? These are just some examples of system where determinism is nigh impossible. We might be able to tunnel through the various and diverse elements that embody the system, but it would be difficult to coherently and tangibly draw all set of relationships, signals, effectors and detectors, etc. to grapple with a complete understanding of the system. Wrestling a strong emergent system would be a task that might even be outside the purview of the highest level of computational power available. And yet, these systems exist, and they emerge and evolve. Yet we try to plan for these systems or plan to direct policies to influence the system, not fully knowing the impact. This is also where the unintended consequences of our action might take free rein.
