Category Archives: Model Thinking
Internal versus External Scale
This article discusses internal and external complexity before we tee up a more detailed discussion on internal versus external scale. This chapter acknowledges that complex adaptive systems have inherent internal and external complexities which are not additive. The impact of these complexities is exponential. Hence, we have to sift through our understanding and perhaps even review the salient aspects of complexity science which have already been covered in relatively more detail in earlier chapter. However, revisiting complexity science is important, and we will often revisit this across other blog posts to really hit home the fundamental concepts and its practical implications as it relates to management and solving challenges at a business or even a grander social scale.

A complex system is a part of a larger environment. It is a safe to say that the larger environment is more complex than the system itself. But for the complex system to work, it needs to depend upon a certain level of predictability and regularity between the impact of initial state and the events associated with it or the interaction of the variables in the system itself. Note that I am covering both – complex physical systems and complex adaptive systems in this discussion. A system within an environment has an important attribute: it serves as a receptor to signals of external variables of the environment that impact the system. The system will either process that signal or discard the signal which is largely based on what the system is trying to achieve. We will dedicate an entire article on system engineering and thinking later, but the uber point is that a system exists to serve a definite purpose. All systems are dependent on resources and exhibits a certain capacity to process information. Hence, a system will try to extract as many regularities as possible to enable a predictable dynamic in an efficient manner to fulfill its higher-level purpose.
Let us understand external complexities. We can interchangeably use the word environmental complexity as well. External complexity represents physical, cultural, social, and technological elements that are intertwined. These environments beleaguered with its own grades of complexity acts as a mold to affect operating systems that are mere artifacts. If operating systems can fit well within the mold, then there is a measure of fitness or harmony that arises between an internal complexity and external complexity. This is the root of dynamic adaptation. When external environments are very complex, that means that there are a lot of variables at play and thus, an internal system has to process more information in order to survive. So how the internal system will react to external systems is important and they key bridge between those two systems is in learning. Does the system learn and improve outcomes on account of continuous learning and does it continually modify its existing form and functional objectives as it learns from external complexity? How is the feedback loop monitored and managed when one deals with internal and external complexities? The environment generates random problems and challenges and the internal system has to accept or discard these problems and then establish a process to distribute the problems among its agents to efficiently solve those problems that it hopes to solve for. There is always a mechanism at work which tries to align the internal complexity with external complexity since it is widely believed that the ability to efficiently align the systems is the key to maintaining a relatively competitive edge or intentionally making progress in solving a set of important challenges.
Internal complexity are sub-elements that interact and are constituents of a system that resides within the larger context of an external complex system or the environment. Internal complexity arises based on the number of variables in the system, the hierarchical complexity of the variables, the internal capabilities of information pass-through between the levels and the variables, and finally how it learns from the external environment. There are five dimensions of complexity: interdependence, diversity of system elements, unpredictability and ambiguity, the rate of dynamic mobility and adaptability, and the capability of the agents to process information and their individual channel capacities.
If we are discussing scale management, we need to ask a fundamental question. What is scale in the context of complex systems? Why do we manage for scale? How does management for scale advance us toward a meaningful outcome? How does scale compute in internal and external complex systems? What do we expect to see if we have managed for scale well? What does the future bode for us if we assume that we have optimized for scale and that is the key objective function that we have to pursue?
Scaling Considerations in Complex Systems and Organizations: Implications
Scale represents size. In a two-dimensional world, it is a linear measurement that presents a nominal ordering of numbers. In other words, 4 is two times two and 6 would be 3 times two. In other words, the difference between 4 and 6 represents an increase in scale by two. We will discuss various aspects of scale and the learnings that we can draw from it. However, before we go down this path, we would like to touch on resource consumption.

As living organisms, we consume resources. An average human being requires 2000 calories of food per day to sustain themselves. An average human being, by the way, is largely defined in terms of size. So it would be better put if we say that a 200lb person would require 2000 calories. However, if we were to regard a specimen that is 10X the size or 2000 lbs., would it require 10X the calories to sustain itself? Conversely, if the specimen was 1/100th the size of the average human being, then would it require 1/100th the calories to sustain itself. Thus, will we consume resources linearly to our size? Are we operating in a simple linear world? And if not, what are the ramifications for science, physics, biology, organizations, cities, climate, etc.?
Let us digress a little bit from the above questions and lay out a few interesting facts. Almost half of the population in the world today live in cities. This is compared to less than 15% of the world population that lived in cities a hundred years ago. It is anticipated that almost 75% of the world population will be living in cities by 2050. The number of cities will increase and so will the size. But for cities to increase in size and numbers, it requires vast amount of resources. In fact, the resource requirements in cities are far more extensive than in agrarian societies. If there is a limit to the resources from a natural standpoint – in other words, if the world is operating on a budget of natural resources – then would this mean that the growth of the cities will be naturally reined in? Will cities collapse because of lack of resources to support its mass?
What about companies? Can companies grow infinitely? Is there a natural point where companies might hit their limit beyond which growth would not be possible? Could a company collapse because the amount of resources that is required to sustain the size would be compromised? Are there other factors aside from resource consumption that play into what might cap the growth and hence the size of the company? Are there overriding factors that come into play that would superimpose the size-resource usage equation such that our worries could be safely kept aside? Are cities and companies governed by some sort of metabolic rate that governs the sustenance of life?

Geoffrey West, a theoretical physicist, has touched on a lot of the questions in his book: Scale: The Universal Laws of Growth, Innovation, Sustainability, and the Pace of Life in Organisms, Cities, Economies, and Companies. He says that a person requires about 90W (watts) of energy to survive. That is a light bulb burning in your living room in one day. That is our metabolic rate. However, just like man does not live by bread alone, an average man has to depend on a number of other artifacts that have agglomerated in bits and pieces to provide a quality of life to maximize sustenance. The person has to have laws, electricity, fuel, automobile, plumbing and water, markets, banks, clothes, phones and engage with other folks in a complex social network to collaborate and compete to achieve their goals. Geoffrey West says that the average person requires almost 11000W or the equivalent of almost 125 90W light bulbs. To put things in greater perspective, the social metabolic rate of 11,000W is almost equivalent to a dozen elephants. (An elephant requires 10X more energy than humans even though they might be 60X the size of the physical human being). Thus, a major portion of our energy is diverted to maintain the social and physical network that closely interplay to maintain our sustenance. And while we consume massive amounts of energy, we also create a massive amount of waste – and that is an inevitable outcome. This is called the entropy impact and we will touch on this in greater detail in later articles. Hence, our growth is not only constrained by our metabolic rate: it is further dampened by entropy that exists as the Second Law of Thermodynamics. And as a system ages, the impact of entropy increases manifold. Yes, it is true: once we get old, we are racing toward our death at a faster pace than when we were young. Our bodies are exhibiting fatigue faster than normal.
Scaling refers to how a system responds when its size changes. As mentioned earlier, does scaling follow a linear model? Do we need to consume 2X resources if we increase the size by 2X? How does scaling impact a Complex Physical System versus a Complex Adaptive System? Will a 2X impact on the initial state create perturbations in a CPS model which is equivalent to 2X? How would this work on a CAS model where the complexity is far from defined and understood because these systems are continuously evolving? Does half as big requires half as much or conversely twice as big requires twice as much? Once again, I have liberally dipped into this fantastic work by Geoffrey West to summarize, as best as possible, the definitions and implications. He proves that we cannot linearly extrapolate energy consumption and size: the world is smattered with evidence that undermines the linear extrapolation model. In fact, as you grow, you become more efficient with respect to energy consumption. The savings of energy due to growth in size is commonly called the economy of scale. His research also suggests two interesting results. When cities or social systems grow, they require an infrastructure to help with the growth. He discovered that it takes 85% resource consumption to grow the systems by 100%. Thus, there is a savings of 15% which is slightly lower than what has been studied on the biological front wherein organisms save 25% as they grow. He calls this sub linear scaling. In contrast, he also introduces the concept of super linear scaling wherein there is a 15% increasing returns to scale when the city or a social system grows. In other words, if the system grows by 100%, the positive returns with respect to such elements like patents, innovation, etc. will grow by 115%. In addition, the negative elements also grow in an equivalent manner – crime, disease, social unrest, etc. Thus, the growth in cities are supported by an efficient infrastructure that generates increasing returns of good and bad elements.

Max Kleiber, a Swiss chemist, in the 1930’s proposed the Kleiber’s law which sheds a lot of light on metabolic rates as energy consumption per unit of time. As mass increases so does the overall metabolic rate but it is not a linear relation – it obeys the power law. It stays that a living organism’s metabolic rate scales to the ¾ power of its mass. If the cat has a mass 100 times that of a mouse, the cat will metabolize about 100 ¾ = 31.63 times more energy per day rather than 100 times more energy per day. Kleiber’s law has led to the metabolic theory of energy and posits that the metabolic rate of organisms is the fundamental biological rate that governs most observed patters in our immediate ecology. There is some ongoing debate on the mechanism that allows metabolic rate to differ based on size. One mechanism is that smaller organisms have higher surface area to volume and thus needs relatively higher energy versus large organisms that have lower surface area to volume. This assumes that energy consumption occurs across surface areas. However, there is another mechanism that argues that energy consumption happens when energy needs are distributed through a transport network that delivers and synthesizes energy. Thus, smaller organisms do not have as a rich a network as large organisms and thus there is greater energy efficiency usage among smaller organisms than larger organisms. Either way, the implications are that body size and temperature (which is a result of internal activity) provide fundamental and natural constraints by which our ecological processes are governed. This leads to another concept called finite time singularity which predicts that unbounded growth cannot be sustained because it would need infinite resources or some K factor that would allow it to increase. The K factor could be innovation, a structural shift in how humans and objects cooperate, or even a matter of jumping on a spaceship and relocating to Mars.

We are getting bigger faster. That is real. The specter of a dystopian future hangs upon us like the sword of Damocles. The thinking is that this rate of growth and scale is not sustainable since it is impossible to marshal the resources to feed the beast in an adequate and timely manner. But interestingly, if we were to dig deeper into history – these thoughts prevailed in earlier times as well but perhaps at different scale. In 1798 Thomas Robert Malthus famously predicted that short-term gains in living standards would inevitably be undermined as human population growth outstripped food production, and thereby drive living standards back toward subsistence. Humanity thus was checkmated into an inevitable conclusion: a veritable collapse spurred by the tendency of population to grow geometrically while food production would increase only arithmetically. Almost two hundred years later, a group of scientists contributed to the 1972 book called Limits to Growth which had similar refrains like Malthus: the population is growing and there are not enough resources to support the growth and that would lead to the collapse of our civilization. However, humanity has negotiated those dark thoughts and we continue to prosper. If indeed, we are governed by this finite time singularity, we are aware that human ingenuity has largely won the day. Technology advancements, policy and institutional changes, new ways of collaboration, etc. have emerged to further delay this “inevitable collapse” that could be result of more mouths to feed than possible. What is true is that the need for new innovative models and new ways of doing things to solve the global challenges wrought by increased population and their correspondent demands will continue to increase at a quicker pace. Once could thus argue that the increased pace of life would not be sustainable. However, that is not a plausible hypothesis based on our assessment of where we are and where we have been.
Let us turn our attention to a business. We want the business to grow or do we want the business to scale? What is the difference? To grow means that your company is adding resources or infrastructure to handle increased demand, at a cost which is equivalent to the level of increased revenue coming in. Scaling occurs when the business is growing faster than the resources that are being consumed. We have already explored that outlier when you grow so big that you are crushed by your weight. It is that fact which limits the growth of organism regardless of issues related to scale. Similarly, one could conceivably argue that there are limits to growth of a company and might even turn to history and show that a lot of large companies of yesteryears have collapsed. However, it is also safe to say that large organizations today are by several factors larger than the largest organizations in the past, and that is largely on account of accumulated knowledge and new forms of innovation and collaboration that have allowed that to happen. In other words, the future bodes well for even larger organizations and if those organizations indeed reach those gargantuan size, it is also safe to draw the conclusion that they will be consuming far less resources relative to current organizations, thus saving more energy and distributing more wealth to the consumers.
Thus, scaling laws limit growth when it assumes that everything else is constant. However, if there is innovation that leads to structural changes of a system, then the limits to growth becomes variable. So how do we effect structural changes? What is the basis? What is the starting point? We look at modeling as a means to arrive at new structures that might allow the systems to be shaped in a manner such that the growth in the systems are not limited by its own constraints of size and motion and temperature (in physics parlance). Thus, a system is modeled at a presumably small scale but with the understanding that as the system is increases in size, the inner workings of emergent complexity could be a problem. Hence, it would be prudent to not linearly extrapolate the model of a small system to that of a large one but rather to exponential extrapolate the complexity of the new system that would emerge. We will discuss this in later articles, but it would be wise to keep this as a mental note as we forge ahead and refine our understanding of scale and its practical implications for our daily consumption.
Model Thinking
| Model Framework |
The fundamental tenet of theory is the concept of “empiria“. Empiria refers to our observations. Based on observations, scientists and researchers posit a theory – it is part of scientific realism.
A scientific model is a causal explanation of how variables interact to produce a phenomenon, usually linearly organized. A model is a simplified map consisting of a few, primary variables that is gauged to have the most explanatory powers for the phenomenon being observed. We discussed Complex Physical Systems and Complex Adaptive Systems early on this chapter. It is relatively easier to map CPS to models than CAS, largely because models become very unwieldy as it starts to internalize more variables and if those variables have volumes of interaction between them. A simple analogy would be the use of multiple regression models: when you have a number of independent variables that interact strongly between each other, autocorrelation errors occur, and the model is not stable or does not have predictive value.

Research projects generally tend to either look at a case study or alternatively, they might describe a number of similar cases that are logically grouped together. Constructing a simple model that can be general and applied to many instances is difficult, if not impossible. Variables are subject to a researcher’s lack of understanding of the variable or the volatility of the variable. What further accentuates the problem is that the researcher misses on the interaction of how the variables play against one another and the resultant impact on the system. Thus, our understanding of our system can be done through some sort of model mechanics but, yet we share the common belief that the task of building out a model to provide all of the explanatory answers are difficult, if not impossible. Despite our understanding of our limitations of modeling, we still develop frameworks and artifact models because we sense in it a tool or set of indispensable tools to transmit the results of research to practical use cases. We boldly generalize our findings from empiria into general models that we hope will explain empiria best. And let us be mindful that it is possible – more so in the CAS systems than CPS that we might have multiple models that would fight over their explanatory powers simply because of the vagaries of uncertainty and stochastic variations.
Popper says: “Science does not rest upon rock-bottom. The bold structure of its theories rises, as it were, above a swamp. It is like a building erected on piles. The piles are driven down from above into the swamp, but not down to any natural or ‘given’ base; and when we cease our attempts to drive our piles into a deeper layer, it is not because we have reached firm ground. We simply stop when we are satisfied that they are firm enough to carry the structure, at least for the time being”. This leads to the satisficing solution: if a model can choose the least number of variables to explain the greatest amount of variations, the model is relatively better than other models that would select more variables to explain the same. In addition, there is always a cost-benefit analysis to be taken into consideration: if we add x number of variables to explain variation in the outcome but it is not meaningfully different than variables less than x, then one would want to fall back on the less-variable model because it is less costly to maintain.
Researchers must address three key elements in the model: time, variation and uncertainty. How do we craft a model which reflects the impact of time on the variables and the outcome? How to present variations in the model? Different variables might vary differently independent of one another. How do we present the deviation of the data in a parlance that allows us to make meaningful conclusions regarding the impact of the variations on the outcome? Finally, does the data that is being considered are actual or proxy data? Are the observations approximate? How do we thus draw the model to incorporate the fuzziness: would confidence intervals on the findings be good enough?
Two other equally other concepts in model design is important: Descriptive Modeling and Normative Modeling.
Descriptive models aim to explain the phenomenon. It is bounded by that goal and that goal only.
There are certain types of explanations that they fall back on: explain by looking at data from the past and attempting to draw a cause and effect relationship. If the researcher is able to draw a complete cause and effect relationship that meets the test of time and independent tests to replicate the results, then the causality turns into law for the limited use-case or the phenomenon being explained. Another explanation method is to draw upon context: explaining a phenomenon by looking at the function that the activity fulfills in its context. For example, a dog barks at a stranger to secure its territory and protect the home. The third and more interesting type of explanation is generally called intentional explanation: the variables work together to serve a specific purpose and the researcher determines that purpose and thus, reverse engineers the understanding of the phenomenon by understanding the purpose and how the variables conform to achieve that purpose.
This last element also leads us to thinking through the other method of modeling – namely, normative modeling. Normative modeling differs from descriptive modeling because the target is not to simply just gather facts to explain a phenomenon, but rather to figure out how to improve or change the phenomenon toward a desirable state. The challenge, as you might have already perceived, is that the subjective shadow looms high and long and the ultimate finding in what would be a normative model could essentially be a teleological representation or self-fulfilling prophecy of the researcher in action. While this is relatively more welcome in a descriptive world since subjectivism is diffused among a larger group that yields one solution, it is not the best in a normative world since variation of opinions that reflect biases can pose a problem.
How do we create a representative model of a phenomenon? First, we weigh if the phenomenon is to be understood as a mere explanation or to extend it to incorporate our normative spin on the phenomenon itself. It is often the case that we might have to craft different models and then weigh one against the other that best represents how the model can be explained. Some of the methods are fairly simple as in bringing diverse opinions to a table and then agreeing upon one specific model. The advantage of such an approach is that it provides a degree of objectivism in the model – at least in so far as it removes the divergent subjectivity that weaves into the various models. Other alternative is to do value analysis which is a mathematical method where the selection of the model is carried out in stages. You define the criteria of the selection and then the importance of the goal (if that be a normative model). Once all of the participants have a general agreement, then you have the makings of a model. The final method is to incorporate all all of the outliers and the data points in the phenomenon that the model seeks to explain and then offer a shared belief into those salient features in the model that would be best to apply to gain information of the phenomenon in a predictable manner.

There are various languages that are used for modeling:
Written Language refers to the natural language description of the model. If price of butter goes up, the quantity demanded of the butter will go down. Written language models can be used effectively to inform all of the other types of models that follow below. It often goes by the name of “qualitative” research, although we find that a bit limiting. Just a simple statement like – This model approximately reflects the behavior of people living in a dense environment …” could qualify as a written language model that seeks to shed light on the object being studied.
Icon Models refer to a pictorial representation and probably the earliest form of model making. It seeks to only qualify those contours or shapes or colors that are most interesting and relevant to the object being studied. The idea of icon models is to pictorially abstract the main elements to provide a working understanding of the object being studied.
Topological Models refer to how the variables are placed with respect to one another and thus helps in creating a classification or taxonomy of the model. Once can have logical trees, class trees, Venn diagrams, and other imaginative pictorial representation of fields to further shed light on the object being studied. In fact, pictorial representations must abide by constant scale, direction and placements. In other words, if the variables are placed on a different scale on different maps, it would be hard to draw logical conclusions by sight alone. In addition, if the placements are at different axis in different maps or have different vectors, it is hard to make comparisons and arrive at a shared consensus and a logical end result.
Arithmetic Models are what we generally fall back on most. The data is measured with an arithmetic scale. It is done via tables, equations or flow diagrams. The nice thing about arithmetic models is that you can show multiple dimensions which is not possible with other modeling languages. Hence, the robustness and the general applicability of such models are huge and thus is widely used as a key language to modeling.
Analogous Models refer to crafting explanations using the power of analogy. For example, when we talk about waves – we could be talking of light waves, radio waves, historical waves, etc. These metaphoric representations can be used to explain phenomenon, but at best, the explanatory power is nebulous, and it would be difficult to explain the variations and uncertainties between two analogous models. However, it still is used to transmit information quickly through verbal expressions like – “Similarly”, “Equivalently”, “Looks like ..” etc. In fact, extrapolation is a widely used method in modeling and we would ascertain this as part of the analogous model to a great extent. That is because we time-box the variables in the analogous model to one instance and the extrapolated model to another instance and we tie them up with mathematical equations.
Complex Physical and Adaptive Systems
There are two models in complexity. Complex Physical Systems and Complex Adaptive Systems! For us to grasp the patterns that are evolving, and much of it seemingly out of our control – it is important to understand both these models. One could argue that these models are mutually exclusive. While the existing body of literature might be inclined toward supporting that argument, we also find some degree of overlap that makes our understanding of complexity unstable. And instability is not to be construed as a bad thing! We might operate in a deterministic framework, and often, we might operate in the realms of a gradient understanding of volatility associated with outcomes. Keeping this in mind would be helpful as we deep dive into the two models. What we hope is that our understanding of these models would raise questions and establish mental frameworks for intentional choices that we are led to make by the system or make to influence the evolution of the system.
Complex Physical Systems (CPS)
Complex Physical Systems are bounded by certain laws. If there are initial conditions or elements in the system, there is a degree of predictability and determinism associated with the behavior of the elements governing the overarching laws of the system. Despite the tautological nature of the term (Complexity Physical System) which suggests a physical boundary, the late 1900’s surfaced some nuances to this model. In other words, if there is a slight and an arbitrary variation in the initial conditions, the outcome could be significantly different from expectations. The assumption of determinism is put to the sword. The notion that behaviors will follow established trajectories if rules are established and the laws are defined have been put to test. These discoveries by introspection offers an insight into the developmental block of complex physical systems and how a better understanding of it will enable us to acknowledge such systems when we see it and thereafter allow us to establish certain toll-gates and actions to navigate, to the extent possible, to narrow the region of uncertainty around outcomes.

The universe is designed as a complex physical system. Just imagine! Let this sink in a bit. A complex physical system might be regarded relatively simpler than a complex adaptive system. And with that in mind, once again …the universe is a complex physical system. We are awed by the vastness and scale of the universe, we regard the skies with an illustrious reverence and we wonder and ruminate on what lies beyond the frontiers of a universe, if anything. Really, there is nothing bigger than the universe in the physical realm and yet we regard it as a simple system. A “Simple” Complex Physical System. In fact, the behavior of ants that lead to the sustainability of an ant colony, is significantly more complex: and we mean by orders of magnitude.

Complexity behavior in nature reflects the tendency of large systems with many components to evolve into a poised “critical” state where minor disturbances or arbitrary changes in initial conditions can create a seemingly catastrophic impact on the overall system such that system changes significantly. And that happens not by some invisible hand or some uber design. What is fundamental to understanding complex systems is to understand that complexity is defined as the variability of the system. Depending on our lens, the scale of variability could change and that might lead to different apparatus that might be required to understand the system. Thus, determinism is not the measure: Stephen Jay Gould has argued that it is virtually impossible to predict the future. We have hindsight explanatory powers but not predictable powers. Hence, systems that start from the initial state over time might represent an outcome that is distinguishable in form and content from the original state. We see complex physical systems all around us. Snowflakes, patterns on coastlines, waves crashing on a beach, rain, etc.
Complex Adaptive Systems (CAS)
Complex adaptive systems, on the contrary, are learning systems that evolve. They are composed of elements which are called agents that interact with one another and adapt in response to the interactions.

Markets are a good example of complex adaptive systems at work.
CAS agents have three levels of activity. As described by Johnson in Complexity Theory: A Short Introduction – the three levels of activity are:
- Performance (moment by moment capabilities): This establishes the locus of all behavioral elements that signify the agent at a given point of time and thereafter establishes triggers or responses. For example, if an object is approaching and the response of the agent is to run, that would constitute a performance if-then outcome. Alternatively, it could be signals driven – namely, an ant emits a certain scent when it finds food: other ants will catch on that trail and act, en masse, to follow the trail. Thus, an agent or an actor in an adaptive system has detectors which allows them to capture signals from the environment for internal processing and it also has the effectors that translate the processing to higher order signals that influence other agents to behave in certain ways in the environment. The signal is the scent that creates these interactions and thus the rubric of a complex adaptive system.
- Credit assignment (rating the usefulness of available capabilities): When the agent gathers experience over time, the agent will start to rely heavily on certain rules or heuristics that they have found useful. It is also typical that these rules may not be the best rules, but it could be rules that are a result of first discovery and thus these rules stay. Agents would rank these rules in some sequential order and perhaps in an ordinal ranking to determine what is the best rule to fall back on under certain situations. This is the crux of decision making. However, there are also times when it is difficult to assign a rank to a rule especially if an action is setting or laying the groundwork for a future course of other actions. A spider weaving a web might be regarded as an example of an agent expending energy with the hope that she will get some food. This is a stage setting assignment that agents have to undergo as well. One of the common models used to describe this best is called the bucket-brigade algorithm which essentially states that the strength of the rule depends on the success of the overall system and the agents that constitute it. In other words, all the predecessors and successors need to be aware of only the strengths of the previous and following agent and that is done by some sort of number assignment that becomes stronger from the beginning of the origin of the system to the end of the system. If there is a final valuable end-product, then the pathway of the rules reflect success. Once again, it is conceivable that this might not be the optimal pathway but a satisficing pathway to result in a better system.
- Rule discovery (generating new capabilities): Performance and credit assignment in agent behavior suggest that the agents are governed by a certain bias. If the agents have been successful following certain rules, they would be inclined toward following those rules all the time. As noted, rules might not be optimal but satisficing. Is improvement a matter of just incremental changes to the process? We do see major leaps in improvement … so how and why does this happen? In other words, someone in the process have decided to take a different rule despite their experiences. It could have been an accident or very intentional.
One of the theories that have been presented is that of building blocks. CAS innovation is a result of reconfiguring the various components in new ways. One quips that if energy is neither created, nor destroyed …then everything that exists today or will exist tomorrow is nothing but a reconfiguration of energy in new ways. All of tomorrow resides in today … just patiently waiting to be discovered. Agents create hypotheses and experiment in the petri dish by reconfiguring their experiences and other agent’s experiences to formulate hypotheses and the runway for discovery. In other words, there is a collaboration element that comes into play where the interaction of the various agents and their assignment as a group to a rule also sets the stepping stone for potential leaps in innovation.
Another key characteristic of CAS is that the elements are constituted in a hierarchical order. Combinations of agents at a lower level result in a set of agents higher up and so on and so forth. Thus, agents in higher hierarchical orders take on some of the properties of the lower orders but it also includes the interaction rules that distinguishes the higher order from the lower order.
Short History of Complexity
Complexity theory began in the 1930’s when natural scientists and mathematicians rallied together to get a deeper understanding of how systems emerge and plays out over time. However, the groundwork of complexity theory began in the 1850’s with Darwin’s introduction to Natural Selection. It was further extended by Mendel’s genetic algorithms. Darwin’s Theory of Evolution has been posited as a slow gradual process. He says that “Natural selection acts only by taking advantage of slight successive variations; she can never take a great and sudden leap, but must advance by short and sure, though slow steps.” Thus, he concluded that complex systems evolve by leaps and the result is an organic formulation of an irreducibly complex system which is composed of many parts, all of which work together closely for the overall system to function. If any part is missing or does not act as expected, then the system becomes unwieldy and breaks down. So it was an early foray into distinguishing the emergent property of a system from the elements that constitute it. Mendel, on the other hand, laid out the property of inheritance across generations. An organic system inherits certain traits that are reconfigured over time and adapts to the environment, thus leading to the development of an organism which for our purposes fall in the realm of a complex outcome. One would imagine that there is a common thread between Darwin’s Natural Selection and Mendel’s laws of genetic inheritance. But that is not the case and that has wide implications in complexity theory. Mendel focused on how the traits are carried across time: the mechanics which are largely determined by some probabilistic functions. The underlying theory of Mendel hinted at the possibility that a complex system is a result of discrete traits that are passed on while Darwin suggests that complexity arises due continuous random variations.

In the 1920’s, literature suggested that a complex system has elements of both: continuous adaptation and discrete inheritance that is hierarchical in nature. A group of biologists reconciled the theories into what is commonly known as the Modern Synthesis. The principles guiding Modern Synthesis were: Natural Selection was the major mechanism for evolutionary change. Small random variations of genes and natural selection result in the origin of new species. Furthermore, the new species might have properties different than the elements that constitute. Modern Synthesis thus provided the framework around Complexity theory. What does this great debate mean for our purposes? Once we arrive at determining whether a system is complex, then how does the debate shed more light into our understanding of complexity. Does this debate shed light into how we regard complexity and how we subsequently deal with it? We need to further extend our thinking by looking at a few new developments that occurred in the 20th century that would give us a better perspective. Let us then continue our journey into the evolution of the thinking around complexity.
Axioms are statements that are self-evident. It serves to be a premise or starting point for further reasoning and arguments. An axiom thus is not contestable because if it, then all the following reasoning that is extended against axioms would fall apart. Thus, for our purposes and our understanding of complexity theory – A complex system has an initial state that is irreducible physically or mathematically.
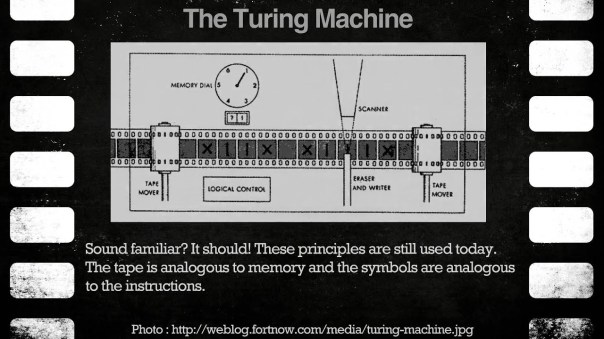
One of the key elements in Complexity is computation or computability. In the 1930’s, Turing introduced the abstract concept of the Turing machine. There is a lot of literature that goes into the specifics of how the machine works but that is beyond the scope of this book. However, there are key elements that can be gleaned from that concept to better understand complex systems. A complex system that evolves is a result of a finite number of steps that would solve a specific challenge. Although the concept has been applied in the boundaries of computational science, I am taking the liberty to apply this to emerging complex systems. Complexity classes help scientists categorize the problems based on how much time and space is required to solve problems and verify solutions. The complexity is thus a function of time and memory. This is a very important concept and we have radically simplified the concept to attend to a self-serving purpose: understand complexity and how to solve the grand challenges? Time complexity refers to the number of steps required to solve a problem. A complex system might not necessarily be the most efficient outcome but is nonetheless an outcome of a series of steps, backward and forward to result in a final state. There are pathways or efficient algorithms that are produced and the mechanical states to produce them are defined and known. Space complexity refers to how much memory that the algorithm depends on to solve the problem. Let us keep these concepts in mind as we round this all up into a more comprehensive work that we will relay at the end of this chapter.
Around the 1940’s, John von Neumann introduced the concept of self-replicating machines. Like Turing, Von Neumann’s would design an abstract machine which, when run, would replicate itself. The machine consists of three parts: a ‘blueprint’ for itself, a mechanism that can read any blueprint and construct the machine (sans blueprint) specified by that blueprint, and a ‘copy machine’ that can make copies of any blueprint. After the mechanism has been used to construct the machine specified by the blueprint, the copy machine is used to create a copy of that blueprint, and this copy is placed into the new machine, resulting in a working replication of the original machine. Some machines will do this backwards, copying the blueprint and then building a machine. The implications are significant. Can complex systems regenerate? Can they copy themselves and exhibit same behavior and attributes? Are emergent properties equivalent? Does history repeat itself or does it rhyme? How does this thinking move our understanding and operating template forward once we identify complex systems?
Let us step forward into the late 1960’s when John Conway started doing experiments extending the concept of the cellular automata. He introduced the concept of the Game of Life in 1970 as a result of his experiments. His main theses was simple : The game is a zero-player game, meaning that its evolution is determined by its initial state, requiring no further input. One interacts with the Game of Life by creating an initial configuration and observing how it evolves, or, for advanced players, by creating patterns with properties. The entire formulation was done on a two-dimensional universe in which patterns evolved over time. It is one of the finest examples in science of how a set of few simple non-arbitrary rules can result in an incredibly complex behavior that is fluid and provides a pleasing pattern over time. In other words, if one were an outsider looking in, you would see a pattern emerging from simple initial states and simple rules. We encourage you to look at several patterns that many people have constructed using different Game of Life parameters. The main elements are as follows. A square grid contains cells that are alive or dead. The behavior of each cell is dependent on the state of its eight immediate neighbors. Eight is an arbitrary number that Conway established to keep the model simple. These cells will strictly follow the rules.
Live Cells:
- A live cell with zero or one live neighbors will die
- A live cell with two or three live neighbors will remain alive
- A live cell with four or more live neighbors will die.
Dead Cells:
- A dead cell with exactly three live neighbors becomes alive
- In all other cases a dead cell will stay dead.
Thus, what his simulation led to is the determination that life is an example of emergence and self-organization. Complex patterns can emerge from the implementation of very simple rules. The game of life thus encourages the notion that “design” and “organization” can spontaneously emerge in the absence of a designer.
Stephen Wolfram introduced the concept of a Class 4 cellular automata of which the Rule of 110 is well known and widely studied. The Class 4 automata validates a lot of the thinking grounding complexity theory. He proves that certain patterns emerge from initial conditions that are not completely random or regular but seems to hint at an order and yet the order is not predictable. Applying a simple rule repetitively to the simplest possible starting point would bode the emergence of a system that is orderly and predictable: but that is far from the truth. The resultant state is that the results exhibit some randomness and yet produce patters with order and some intelligence.
Thus, his main conclusion from his discovery is that complexity does not have to beget complexity: simple forms following repetitive and deterministic rules can result in systems that exhibit complexity that is unexpected and unpredictable. However, he sidesteps the discussion around the level of complexity that his Class 4 automata generates. Does this determine or shed light on evolution, how human beings are formed, how cities evolve organically, how climate is impacted and how the universe undergoes change? One would argue that is not the case. However, if you take into account Darwin’s natural selection process, the Mendel’s law of selective genetics and its corresponding propitiation, the definitive steps proscribed by the Turing machine that captures time and memory, Von Neumann’s theory of machines able to replicate themselves without any guidance, and Conway’s force de tour in proving that initial conditions without any input can create intelligent systems – you essentially can start connecting the dots to arrive at a core conclusion: higher order systems can organically create itself from initial starting conditions naturally. They exhibit a collective intelligence which is outside the boundaries of precise prediction. In the previous chapter we discussed complexity and we introduced an element of subjective assessment to how we regard what is complex and the degree of complexity. Whether complexity falls in the realm of a first-person subjective phenomenon or a scientific third-party objective phenomenon has yet to be ascertained. Yet it is indisputable that the product of a complex system might be considered a live pattern of rules acting upon agents to cause some deterministic but random variation.
Building a Lean Financial Infrastructure!
A lean financial infrastructure presumes the ability of every element in the value chain to preserve and generate cash flow. That is the fundamental essence of the lean infrastructure that I espouse. So what are the key elements that constitute a lean financial infrastructure?
And given the elements, what are the key tweaks that one must continually make to ensure that the infrastructure does not fall into entropy and the gains that are made fall flat or decay over time. Identification of the blocks and monitoring and making rapid changes go hand in hand.
The Key Elements or the building blocks of a lean finance organization are as follows:
- Chart of Accounts: This is the critical unit that defines the starting point of the organization. It relays and groups all of the key economic activities of the organization into a larger body of elements like revenue, expenses, assets, liabilities and equity. Granularity of these activities might lead to a fairly extensive chart of account and require more work to manage and monitor these accounts, thus requiring incrementally a larger investment in terms of time and effort. However, the benefits of granularity far exceeds the costs because it forces management to look at every element of the business.
- The Operational Budget: Every year, organizations formulate the operational budget. That is generally a bottoms up rollup at a granular level that would map to the Chart of Accounts. It might follow a top-down directive around what the organization wants to land with respect to income, expense, balance sheet ratios, et al. Hence, there is almost always a process of iteration in this step to finally arrive and lock down the Budget. Be mindful though that there are feeders into the budget that might relate to customers, sales, operational metrics targets, etc. which are part of building a robust operational budget.

- The Deep Dive into Variances: As you progress through the year and part of the monthly closing process, one would inquire about how the actual performance is tracking against the budget. Since the budget has been done at a granular level and mapped exactly to the Chart of Accounts, it thus becomes easier to understand and delve into the variances. Be mindful that every element of the Chart of Account must be evaluated. The general inclination is to focus on the large items or large variances, while skipping the small expenses and smaller variances. That method, while efficient, might not be effective in the long run to build a lean finance organization. The rule, in my opinion, is that every account has to be looked and the question should be – Why? If the management has agreed on a number in the budget, then why are the actuals trending differently. Could it have been the budget and that we missed something critical in that process? Or has there been a change in the underlying economics of the business or a change in activities that might be leading to these “unexpected variances”. One has to take a scalpel to both – favorable and unfavorable variances since one can learn a lot about the underlying drivers. It might lead to managerially doing more of the better and less of the worse. Furthermore, this is also a great way to monitor leaks in the organization. Leaks are instances of cash that are dropping out of the system. Much of little leaks amounts to a lot of cash in total, in some instances. So do not disregard the leaks. Not only will that preserve the cash but once you understand the leaks better, the organization will step up in efficiency and effectiveness with respect to cash preservation and delivery of value.

- Tweak the process: You will find that as you deep dive into the variances, you might want to tweak certain processes so these variances are minimized. This would generally be true for adverse variances against the budget. Seek to understand why the variance, and then understand all of the processes that occur in the background to generate activity in the account. Once you fully understand the process, then it is a matter of tweaking this to marginally or structurally change some key areas that might favorable resonate across the financials in the future.
- The Technology Play: Finally, evaluate the possibilities of exploring technology to surface issues early, automate repetitive processes, trigger alerts early on to mitigate any issues later, and provide on-demand analytics. Use technology to relieve time and assist and enable more thinking around how to improve the internal handoffs to further economic value in the organization.


All of the above relate to managing the finance and accounting organization well within its own domain. However, there is a bigger step that comes into play once one has established the blocks and that relates to corporate strategy and linking it to the continual evolution of the financial infrastructure.
The essential question that the lean finance organization has to answer is – What can the organization do so that we address every element that preserves and enhances value to the customer, and how do we eliminate all non-value added activities? This is largely a process question but it forces one to understand the key processes and identify what percentage of each process is value added to the customer vs. non-value added. This can be represented by time or cost dimension. The goal is to yield as much value added activities as possible since the underlying presumption of such activity will lead to preservation of cash and also increase cash acquisition activities from the customer.
The Unbearable Lightness of Being
Where the mind is without fear and the head is held high
Where knowledge is free
Where the world has not been broken up into fragments
By narrow domestic walls
Where words come out from the depth of truth
Where tireless striving stretches its arms towards perfection
Where the clear stream of reason has not lost its way
Into the dreary desert sand of dead habit
Where the mind is led forward by thee
Into ever-widening thought and action
Into that heaven of freedom, my Father, let my country awake.
– Rabindranath Tagore

Among the many fundamental debates in philosophy, one of the fundamental debates has been around the concept of free will. The debates have stemmed around two arguments associated with free will.
1) Since future actions are governed by the circumstances of the present and the past, human beings future actions are predetermined on account of the learnings from the past. Hence, the actions that happen are not truly a consequent of free will.
2) The counter-argument is that future actions may not necessarily be determined and governed by the legacy of the present and the past, and hence leaves headroom for the individual to exercise free will.

Now one may wonder what determinism or lack of it has anything to do with the current state of things in an organizational context. How is this relevant? Why are the abstract notions of determinism and free will important enough to be considered in the context of organizational evolution? How does the meaning lend itself to structured institutions like business organizations, if you will, whose sole purpose is to create products and services to meet the market demand.
So we will throw a factual wrinkle in this line of thought. We will introduce now an element of chance. How does chance change the entire dialectic? Simply because chance is an unforeseen and random event that may not be pre-determined; in fact, a chance event may not have a causal trigger. And chance or luck could be meaningful enough to untether an organization and its folks to explore alternative paths. It is how the organization and the people are aligned to take advantage of that random nondeterministic future that could make a huge difference to the long term fate of the organization.
The principle of inductive logic states that what is true for n and n+1 would be true for n+2. The inductive logic creates predictability and hence organizations create pathways to exploit the logical extension of inductive logic. It is the most logical apparatus that exists to advance groups in a stable but robust manner to address the multitude of challenges that that they have to grapple with. After all, the market is governed by animal spirits! But let us think through this very carefully. All competition or collaboration that occurs among groups to address the market demands result in homogenous behavior with general homogeneous outcomes. Simply put, products and services become commoditized. Their variance is not unique and distinctive. However, they could be just be distinctive enough to eke out enough profits in the margins before being absorbed into a bigger whole. At that point, identity is effaced over time. Organizations gravitate to a singularity. Unique value propositions wane over time.

So let us circle back to chance. Chance is our hope to create divergence. Chance is the factoid that cancels out the inductive vector of industrial organization. Chance does not exist … it is not a “waiting for Godot” metaphor around the corner. If it always did, it would have been imputed by the determinists in their inductive world and we would end up with a dystopian homogenous future. Chance happens. And sometimes it has a very short half-life. And if the organization and people are aligned and their mindset is adapted toward embracing and exploiting that fleeting factoid of chance, the consequences could be huge. New models would emerge, new divergent paths would be traduced and society and markets would burst into a garden of colorful ideas in virtual oasis of new markets.

So now to tie this all to free will and to the unbearable lightness of being! It is the existence of chance that creates the opportunity to exercise free will on the part of an individual, but it is the organizations responsibility to allow the individual to unharness themselves from organization inertia. Thus, organizations have to perpetuate an environment wherein employees are afforded some headroom to break away. And I don’t mean break away as in people leaving the organization to do their own gigs; I mean breakaway in thought and action within the boundaries of the organization to be open to element of chance and exploit it. Great organizations do not just encourage the lightness of being … unharnessing the talent but rather – the great organizations are the ones that make the lightness of being unbearable. These individuals are left with nothing but an awareness and openness to chance to create incredible values … far more incredible and awe inspiring and momentous than a more serene state of general business as usual affairs.
Importance of Heroes and Narratives in Organizations
“My own heroes are the dreamers, those men and women who tried to make the world a better place than when they found it, whether in small ways or great ones. Some succeeded, some failed, most had mixed results… but it is the effort that’s heroic, as I see it. Win or lose, I admire those who fight the good fight.” – George Martin
“Stories, like people and butterflies and songbirds’ eggs and human hearts and dreams, are also fragile things, made up of nothing stronger or more lasting than twenty-six letters and a handful of punctuation marks. Or they are words on the air, composed of sounds and ideas-abstract, invisible, gone once they’ve been spoken-and what could be more frail than that? But some stories, small, simple ones about setting out on adventures or people doing wonders, tales of miracles and monsters, have outlasted all the people who told them, and some of them have outlasted the lands in which they were created.” – Neil Gaiman

Heroes are not born. Circumstance and happenstance create heroes. In some cases, heroes are individuals who walk into a minefield of uncertainty that threatens their natural inclination for self-preservation in the interest of value systems and people that are alien to the individual. Thus, a private in an army is a hero already in the fact that he/she is walking into possible harm’s way and serving a cause to serve and protect people not necessarily related to him/her. One has heard the adage – one man’s freedom fighter is another person’s terrorist. Thus, someone whom we call a terrorist may be perceived a hero by someone else. Thus, in this case …it all becomes a matter of a point of view, but the fundamental point remains – a hero is considered a person who abnegates and abjures their rights to self-preservation for some greater perceived good.
Sustaining innovation is a vital yet difficult task. Innovation requires the coordinated efforts of many actors to facilitate (1) the recombination of ideas to generate novelty, (2) real-time problem solving, and (3) linkages between present innovation efforts with past experiences and future aspirations. Innovation narratives are cultural mechanisms that address these coordination requirements by enabling translation. Specifically, innovation narratives are powerful mechanisms for translating ideas across the organization so that they are comprehensible and appear legitimate to others. Narratives also enable people to translate emergent situations that are ambiguous or equivocal so as to promote real-time problem solving. With their accumulation, innovation narratives provide a generative memory for organizations that enable people to translate ideas accumulated from particular instances of past innovation to inform current and future efforts.

The concept of collective identity has gained prominence within organizational theory as researchers have studied how it consequentially shapes organizational behavior. However, much less attention has been paid to the question of how nascent collective identities become legitimated. Although it is conventionally argued that membership expansion leads to collective identity legitimacy, one draws on the notion of cultural entrepreneurship to argue that the relationship is more complex and is culturally mediated by the stories told by group members. Legitimacy is more likely to be achieved when members articulate a clear defining collective identity story that identifies the group’s orienting purpose and core practices. Although membership expansion can undermine legitimation by introducing discrepant actors and practices to a collective identity, this potential downside is mitigated by compelling narratives, which help to coordinate expansion. And that is where the heroes can be interwoven into organizational theory and behavior. It is important to create environments that by happenstance and circumstance create heroes. The architecture of great organizations imputes heroes and narratives in their tapestry.
Heroes and narratives are instrumental in organizations that forge a pathway to long-term sustenance and growth. Hence, we are quick to idolize figures – Iacocca, Welch, Jobs, Ellison, Gates, Benioff, Gerstner, Branson, Bezos, Zuckerberg, Brin and Page, etc. We learn narratives through case studies, news print, scholarly books on successful companies; and we emulate and steal and copy and parody and so much more … not necessarily because we want to be them but we want to create our identity in our own lair in ecosystems that move with or against the strongest currents.

So it is essential to celebrate the heroes and the narratives of great companies as an additional instrument to ignite engagement and foray into uncharted territories and conquer the unknown. Hence, personally I have also found solace in reading biographies of people who have made a difference, and a great pleasure in vicariously living through the ebbs and troughs of great companies

Medici Effect – Encourage Innovation in the Organization
“Creativity is just connecting things. When you ask creative people how they did something, they feel a little guilty because they didn’t really do it, they just saw something. It seemed obvious to them after a while. That’s because they were able to connect experiences they’ve had and synthesize new things. And the reason they were able to do that was that they’ve had more experiences or they have thought more about their experiences than other people.”
– Steve Jobs
What is the Medici Effect?
Frans Johanssen has written a lovely book on the Medici Effect. The term “Medici” relates to the Medici family in Florence that made immense contributions in art, architecture and literature. They were pivotal in catalyzing the Renaissance, and some of the great artists and scientists that we revere today – Donatello, Michelangelo, Leonardo da Vinci, and Galileo were commissioned for their works by the family.

Renaissance was the resurgence of the old Athenian democracy. It merged distinctive areas of humanism, philosophy, sciences, arts and literature into a unified body of knowledge that would advance the cause of human civilization. What the Medici effect speaks to is the outcome that is the result of creating a system that would incorporate what on first glance, may seem distinctive and discrete disciplines, into holistic outcomes and a shared simmering of wisdom that permeated the emergence of new disciplines, thoughts and implementations.
Supporting the organization to harness the power of the Medici Effect
We are past the industrial era, the Progressive era and the Information era. There are no formative lines that truly distinguish one era from another, but our knowledge has progressed along gray lines that have pushed the limits of human knowledge. We are now wallowing in a crucible wherein distinct disciplines have crisscrossed and merged together. The key thesis in the Medici effect is that the intersections of these distinctive disciplines enable the birth of new breakthrough ideas and leapfrog innovation.

So how do we introduce the Medici Effect in organizations?
Some of the key ways to implement the model is really to provide the support infrastructure for
1. Connections: Our brains are naturally wired toward associations. We try to associate a concept with contextual elements around that concept to give the concept more meaning. We learn by connecting concepts and associating them, for the most part, with elements that we are conversant in. However, one can create associations within a narrow parameter, constrained within certain semantic models that we have created. Organizations can hence channelize connections by implementing narrow parameters. On the other hand, connections can be far more free-form. That means that the connector thinks beyond the immediate boundaries of their domain or within certain domains that are “pre-ordained”. In those cases, we create what is commonly known as divergent thinking. In that approach, we cull elements from seemingly different areas but we thread them around some core to generate new approaches, new metaphors, and new models. Ensuring that employees are able to safely reach out to other nodes of possibilities is the primary implementation step to generate the Medici effect.
2. Collaborations: Connecting different streams of thought in different disciplines is a primary and formative step. To advance this further, organization need to be able to provide additional systems wherein people can collaborate among themselves. In fact, the collaboration impact accentuates the final outcome sooner. So enabling connections and collaboration work in sync to create what I would call – the network impact on a marketplace of ideas.
3. Learning Organization: Organizations need to continuously add fuel to the ecosystem. In other words, they need to bring in speakers, encourage and invest in training programs, allow exploration possibilities by developing an internal budget for that purpose and provide some time and degree of freedom for people to mull over ideas. This enables collaboration to be enriched within the context of diverse learning.
4. Encourage Cultural Diversity: Finally, organizations have to invest in cultural diversity. People from different cultures have varied viewpoints and information and view issues from different perspectives and cultures. Given the fact that we are more globalized now, the innate understanding and immersion in cultural experience enhances the Medici effect. It also creates innovation and ground-breaking thoughts within a broader scope of compassion, humanism, social and shared responsibilities.

Implementing systems to encourage the Medici effect will enable organizations to break out from legacy behavior and trammel into unguarded territories. The charter toward unknown but exciting possibilities open the gateway for amazing and awesome ideas that engage the employees and enable them to beat a path to the intersection of new ideas.
The Big Data Movement: Importance and Relevance today?
We are entering into a new age wherein we are interested in picking up a finer understanding of relationships between businesses and customers, organizations and employees, products and how they are being used, how different aspects of the business and the organizations connect to produce meaningful and actionable relevant information, etc. We are seeing a lot of data, and the old tools to manage, process and gather insights from the data like spreadsheets, SQL databases, etc., are not scalable to current needs. Thus, Big Data is becoming a framework to approach how to process, store and cope with the reams of data that is being collected.

According to IDC, it is imperative that organizations and IT leaders focus on the ever-increasing volume, variety and velocity of information that forms big data.
- Volume. Many factors contribute to the increase in data volume – transaction-based data stored through the years, text data constantly streaming in from social media, increasing amounts of sensor data being collected, etc. In the past, excessive data volume created a storage issue. But with today’s decreasing storage costs, other issues emerge, including how to determine relevance amidst the large volumes of data and how to create value from data that is relevant.
- Variety. Data today comes in all types of formats – from traditional databases to hierarchical data stores created by end users and OLAP systems, to text documents, email, meter-collected data, video, audio, stock ticker data and financial transactions. By some estimates, 80 percent of an organization’s data is not numeric! But it still must be included in analyses and decision making.
- Velocity. According to Gartner, velocity “means both how fast data is being produced and how fast the data must be processed to meet demand.” RFID tags and smart metering are driving an increasing need to deal with torrents of data in near-real time. Reacting quickly enough to deal with velocity is a challenge to most organizations.
SAS has added two additional dimensions:
- Variability. In addition to the increasing velocities and varieties of data, data flows can be highly inconsistent with periodic peaks. Is something big trending in the social media? Daily, seasonal and event-triggered peak data loads can be challenging to manage – especially with social media involved.
- Complexity. When you deal with huge volumes of data, it comes from multiple sources. It is quite an undertaking to link, match, cleanse and transform data across systems. However, it is necessary to connect and correlate relationships, hierarchies and multiple data linkages or your data can quickly spiral out of control. Data governance can help you determine how disparate data relates to common definitions and how to systematically integrate structured and unstructured data assets to produce high-quality information that is useful, appropriate and up-to-date.

So to reiterate, Big Data is a framework stemming from the realization that the data has gathered significant pace and that it’s growth has exceeded the capacity for an organization to handle, store and analyze the data in a manner that offers meaningful insights into the relationships between data points. I am calling this a framework, unlike other materials that call Big Data a consequent of the inability of organizations to handle mass amounts of data. I refer to Big Data as a framework because it sets the parameters around an organizations’ decision as to when and which tools must be deployed to address the data scalability issues.

Thus to put the appropriate parameters around when an organization must consider Big Data as part of their analytics roadmap in order to understand the patterns of data better, they have to answer the following ten questions:
- What are the different types of data that should be gathered?
- What are the mechanisms that have to be deployed to gather the relevant data?
- How should the data be processed, transformed and stored?
- How do we ensure that there is no single point of failure in data storage and data loss that may compromise data integrity?
- What are the models that have to be used to analyze the data?
- How are the findings of the data to be distributed to relevant parties?
- How do we assure the security of the data that will be distributed?
- What mechanisms do we create to implement feedback against the data to preserve data integrity?
- How do we morph the big data model into new forms that accounts for new patterns to reflect what is meaningful and actionable?
- How do we create a learning path for the big data model framework?
Some of the existing literature have commingled Big Data framework with analytics. In fact, the literature has gone on to make a rather assertive statement i.e. that Big Data and predictive analytics be looked upon in the same vein. Nothing could be further from the truth!
There are several tools available in the market to do predictive analytics against a set of data that may not qualify for the Big Data framework. While I was the CFO at Atari, we deployed business intelligence tools using Microstrategy, and Microstrategy had predictive modules. In my recent past, we had explored SAS and Minitab tools to do predictive analytics. In fact, even Excel can do multivariate, ANOVA and regressions analysis and best curve fit analysis. These analytical techniques have been part of the analytics arsenal for a long time. Different data sizes may need different tools to instantiate relevant predictive analysis. This is a very important point because companies that do not have Big Data ought to seriously reconsider their strategy of what tools and frameworks to use to gather insights. I have known companies that have gone the Big Data route, although all data points ( excuse my pun), even after incorporating capacity and forecasts, suggest that alternative tools are more cost-effective than implementing Big Data solutions. Big Data is not a one-size fit-all model. It is an expensive implementation. However, for the right data size which in this case would be very large data size, Big Data implementation would be extremely beneficial and cost effective in terms of the total cost of ownership.
Areas where Big Data Framework can be applied!
Some areas lend themselves to the application of the Big Data Framework. I have identified broadly four key areas:
- Marketing and Sales: Consumer behavior, marketing campaigns, sales pipelines, conversions, marketing funnels and drop-offs, distribution channels are all areas where Big Data can be applied to gather deeper insights.
- Human Resources: Employee engagement, employee hiring, employee retention, organization knowledge base, impact of cross-functional training, reviews, compensation plans are elements that Big Data can surface. After all, generally over 60% of company resources are invested in HR.
- Production and Operational Environments: Data growth, different types of data appended as the business learns about the consumer, concurrent usage patterns, traffic, web analytics are prime examples.
- Financial Planning and Business Operational Analytics: Predictive analytics around bottoms-up sales, marketing campaigns ROI, customer acquisitions costs, earned media and paid media, margins by SKU’s and distribution channels, operational expenses, portfolio evaluation, risk analysis, etc., are some of the examples in this category.
Hadoop: A Small Note!
Hadoop is becoming a more widely accepted tool in addressing Big Data Needs. It was invented by Google so they could index the structural and text information that they were collecting and present meaningful and actionable results to the users quickly. It was further developed by Yahoo that tweaked Hadoop for enterprise applications.
Hadoop runs on a large number of machines that don’t share memory or disks. The Hadoop software runs on each of these machines. Thus, if you have for example – over 10 gigabytes of data – you take that data and spread that across different machines. Hadoop tracks where all these data resides! The servers or machines are called nodes, and the common logical categories around which the data is disseminated are called clusters. Thus each server operates on its own little piece of the data, and then once the data is processed, the results are delivered to the main client as a unified whole. The method of reducing the disparate sources of information residing in various nodes and clusters into one unified whole is the process of MapReduce, an important mechanism of Hadoop. You will also hear something called Hive which is nothing but a data warehouse. This could be a structured or unstructured warehouse upon which the Hadoop works upon, processes data, enables redundancy across the clusters and offers a unified solution through the MapReduce function.

Personally, I have always been interested in Business Intelligence. I have always considered BI as a stepping stone, in the new age, to be a handy tool to truly understand a business and develop financial and operational models that are fairly close to the trending insights that the data generates. So my ear is always to the ground as I follow the developments in this area … and though I have not implemented a Big Data solution, I have always been and will continue to be interested in seeing its applications in certain contexts and against the various use cases in organizations.
